- Published on
Detecting Structural Breaks and Explosive Dynamics
A long financial series may not follow one stable law. The notebooks use recursive right-tailed unit-root statistics to mark explosive episodes and PELT to divide a series into segments with different behavior.
The central relation
The right-tailed augmented Dickey-Fuller regression is
is the logged level, is its change, is the lag order, and are lag coefficients. The test asks whether lies in the explosive right tail rather than below zero.
Locating changes in financial time series
A controlled two-bubble path checks episode detection against known intervals. The public segmentation shows the dates selected by the PELT objective.
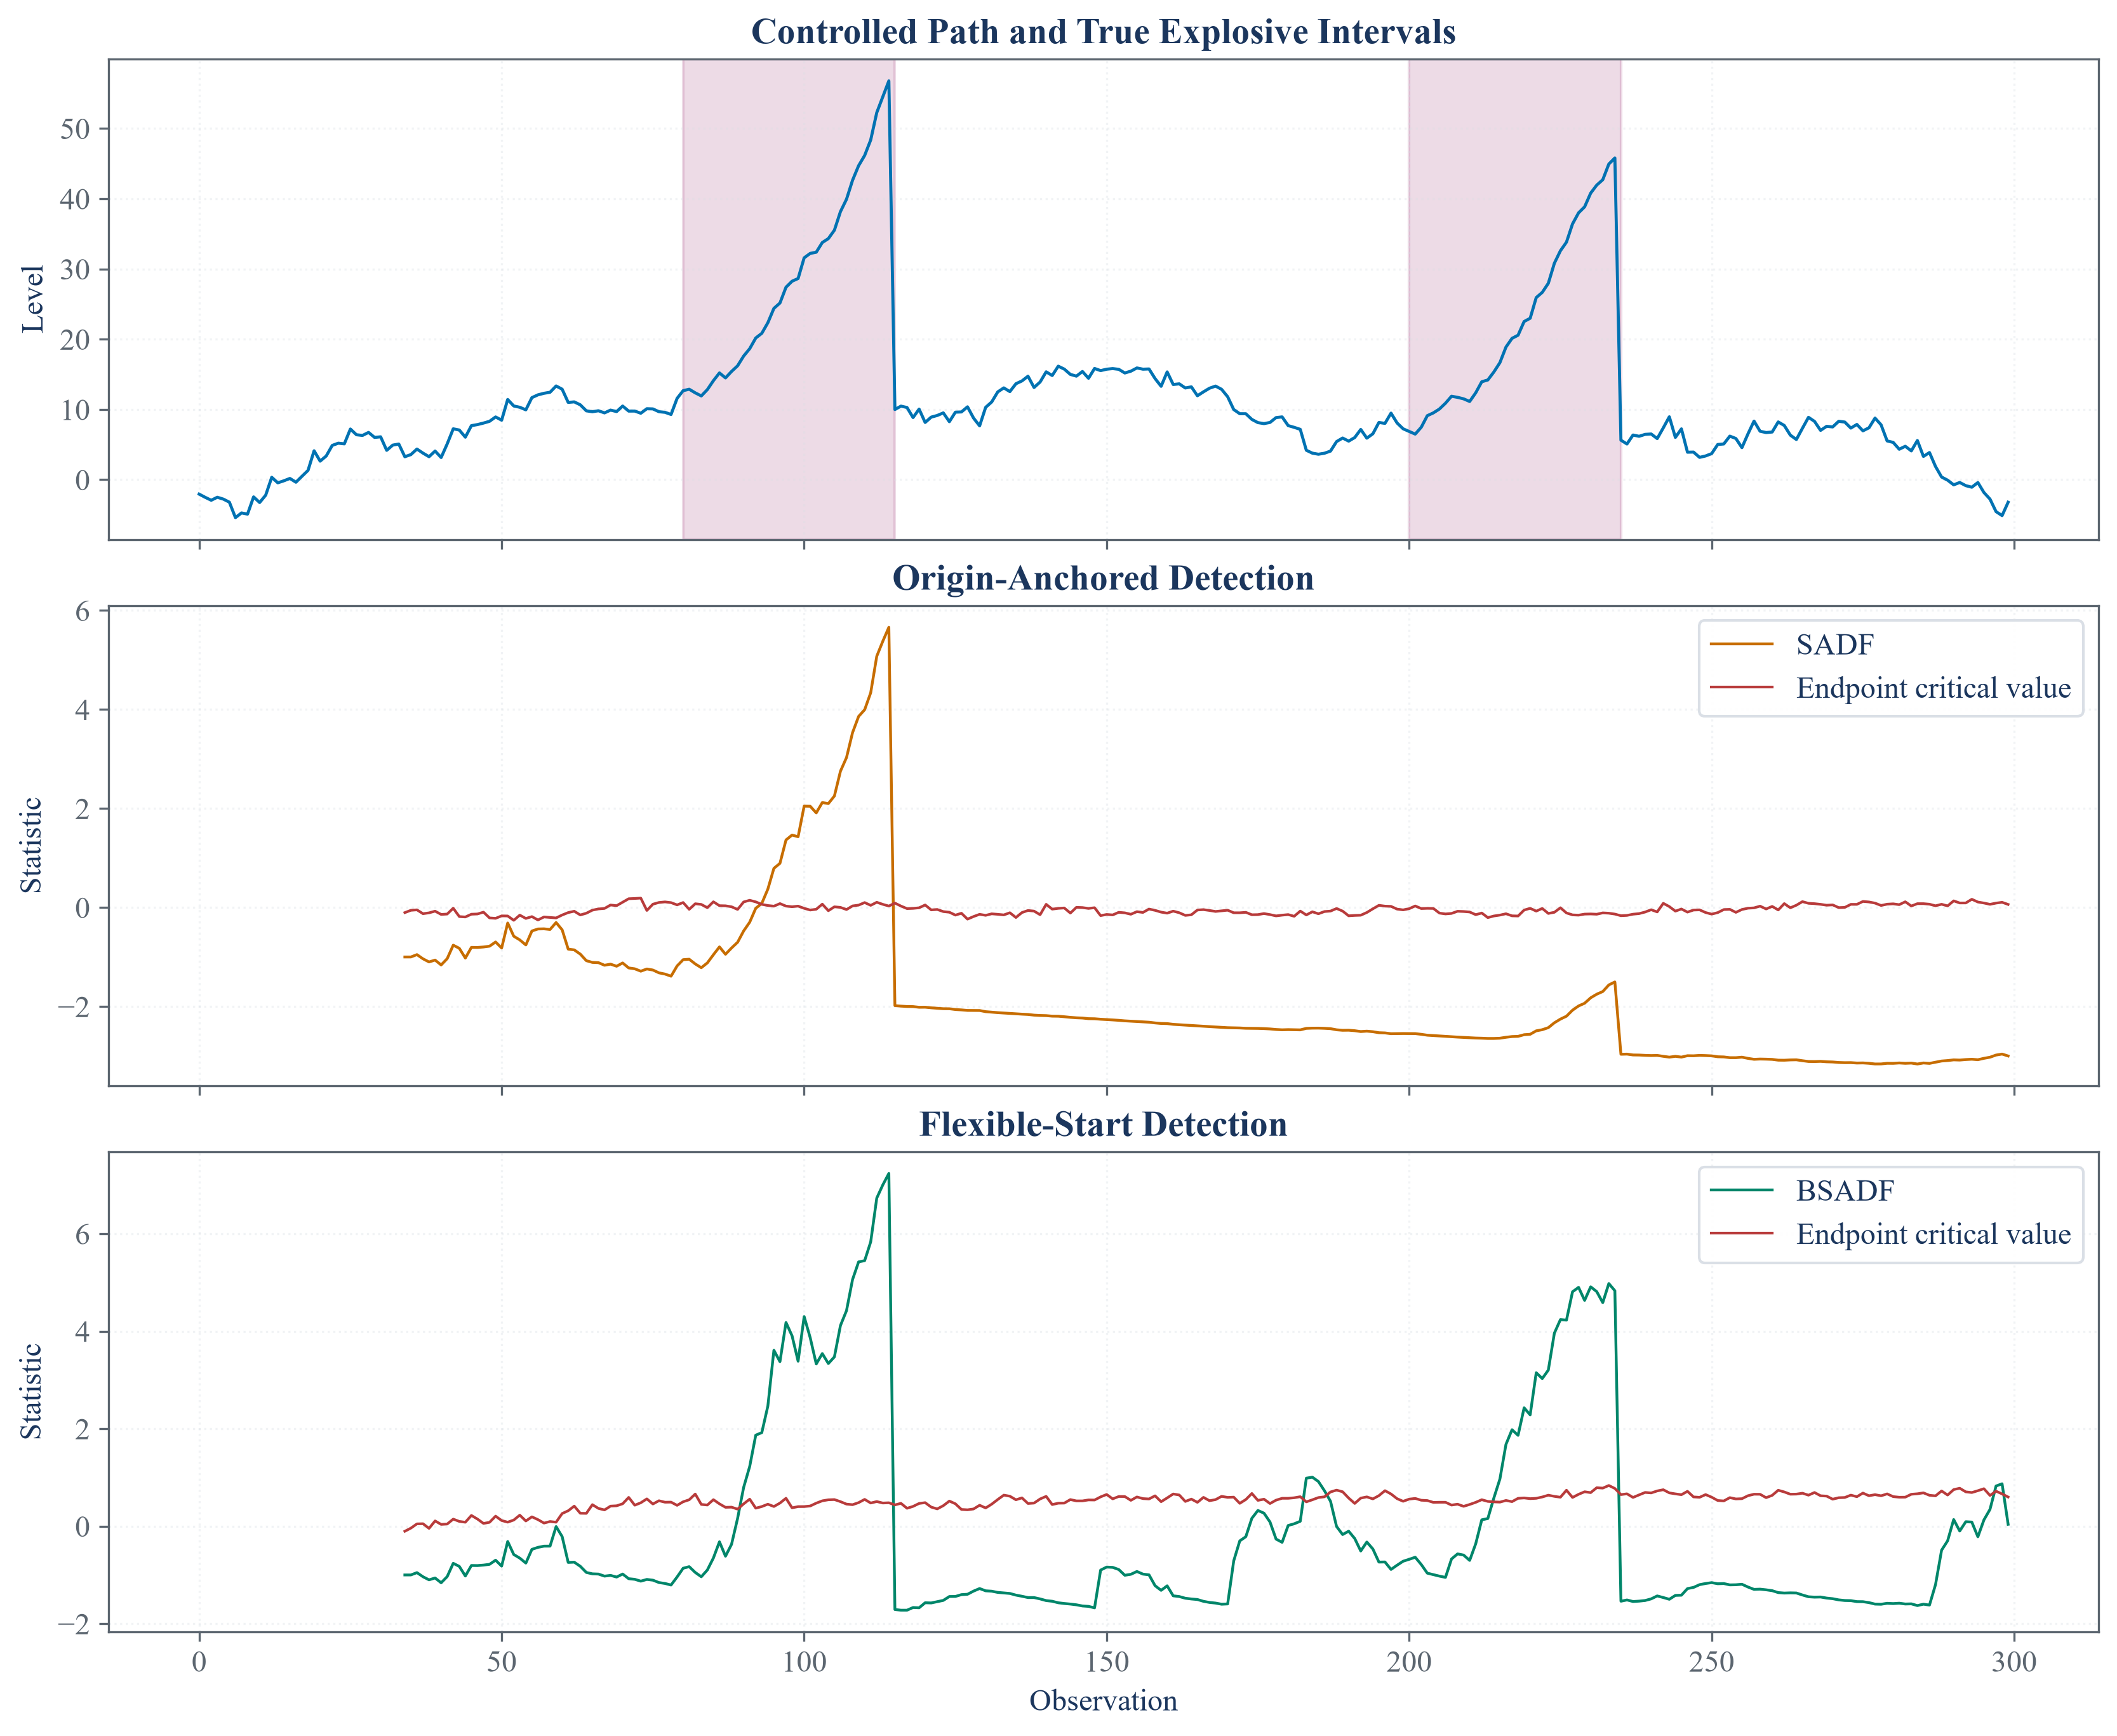
The controlled path provides known explosive intervals, allowing the recursive test to be checked for missed and extra detections.
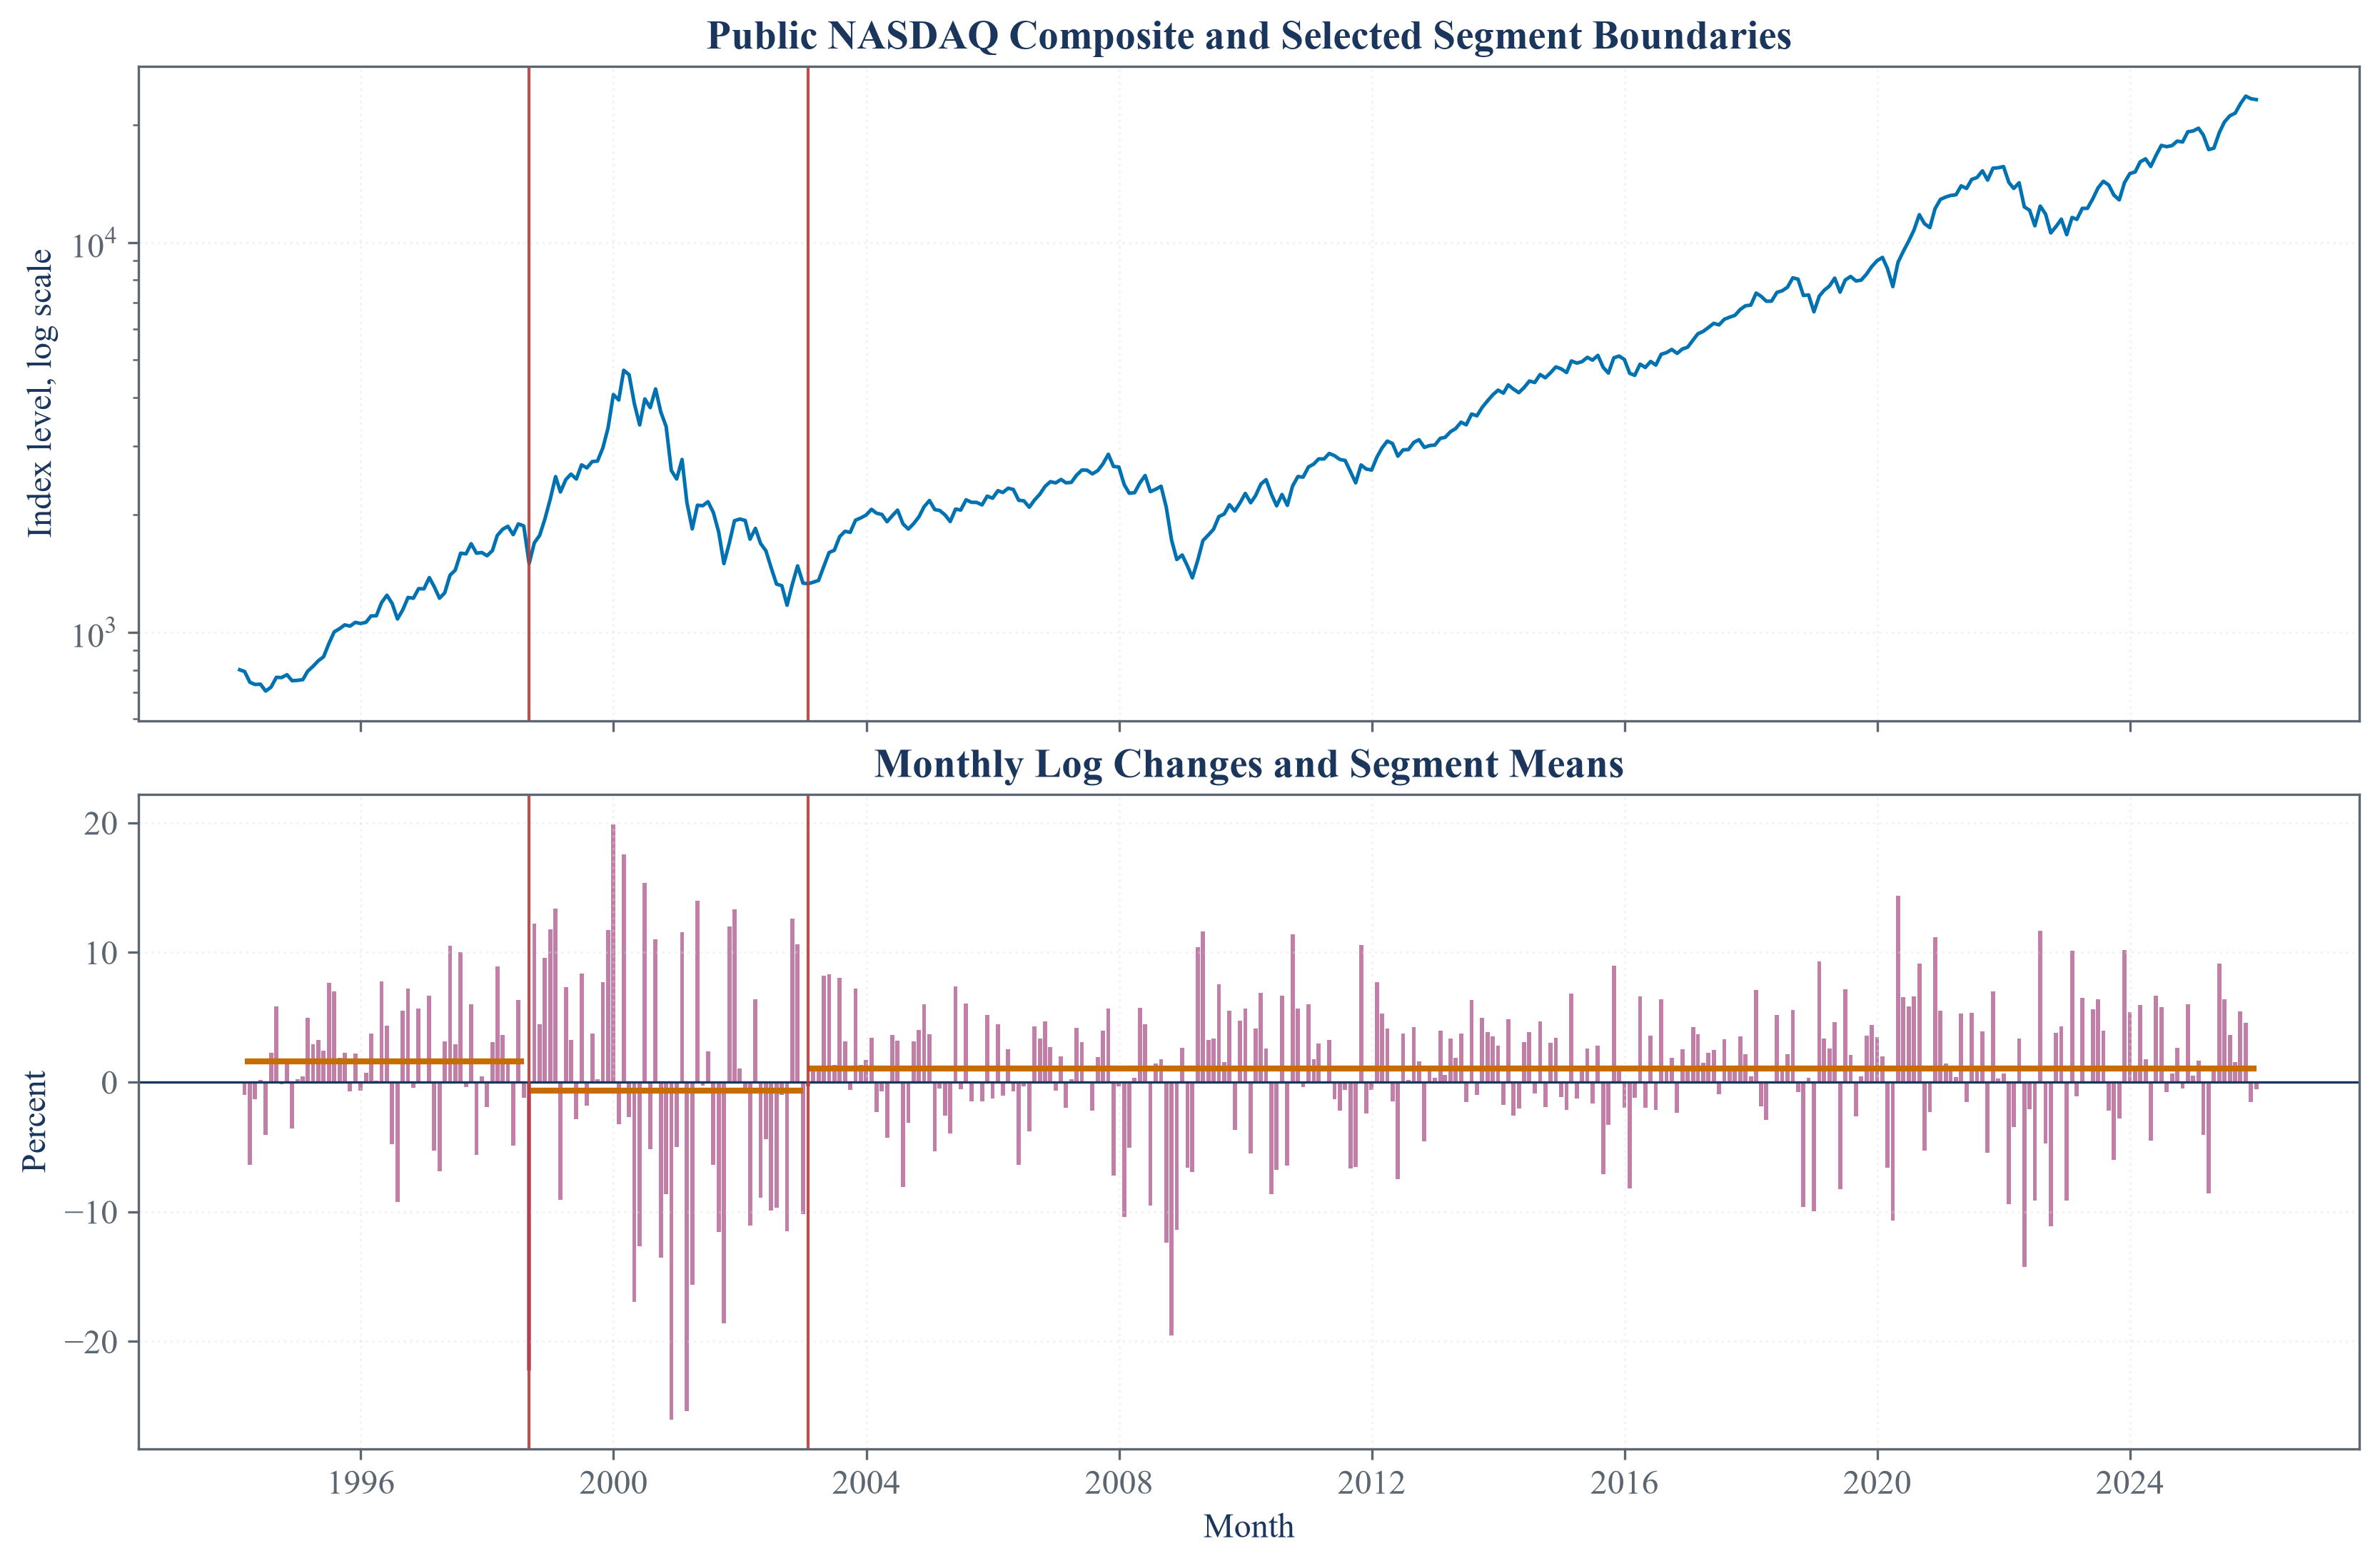
The PELT result divides the public series according to the chosen cost and penalty. The dates describe this fitted segmentation rather than a universal market chronology.
Break dates depend on the statistic, lag choice, minimum segment length, and penalty. The notebooks make those choices visible and test them under controlled cases.
Notebooks
| 1. Recursive Right-Tailed Unit-Root Statistics |
| 2. Detecting explosive episodes with right-tailed tests |
| 3. Detecting change points with PELT |