- Published on
Event-Based Measures of Financial Time
A bar is a sampling rule, not a neutral container. The notebooks compare several ways to measure financial time and show how imbalance and run bars stop when directional evidence crosses a stated threshold.
The central relation
A transaction record and its dollar value can be written as
identifies a transaction, is its time, its price, and its volume. The product is dollar value. Different clocks accumulate records, volume, or dollar value before closing a bar.
How trading activity changes the financial clock
The figures compare ordinary clock time with activity-based clocks and then trace the stopping paths used by imbalance and run bars.
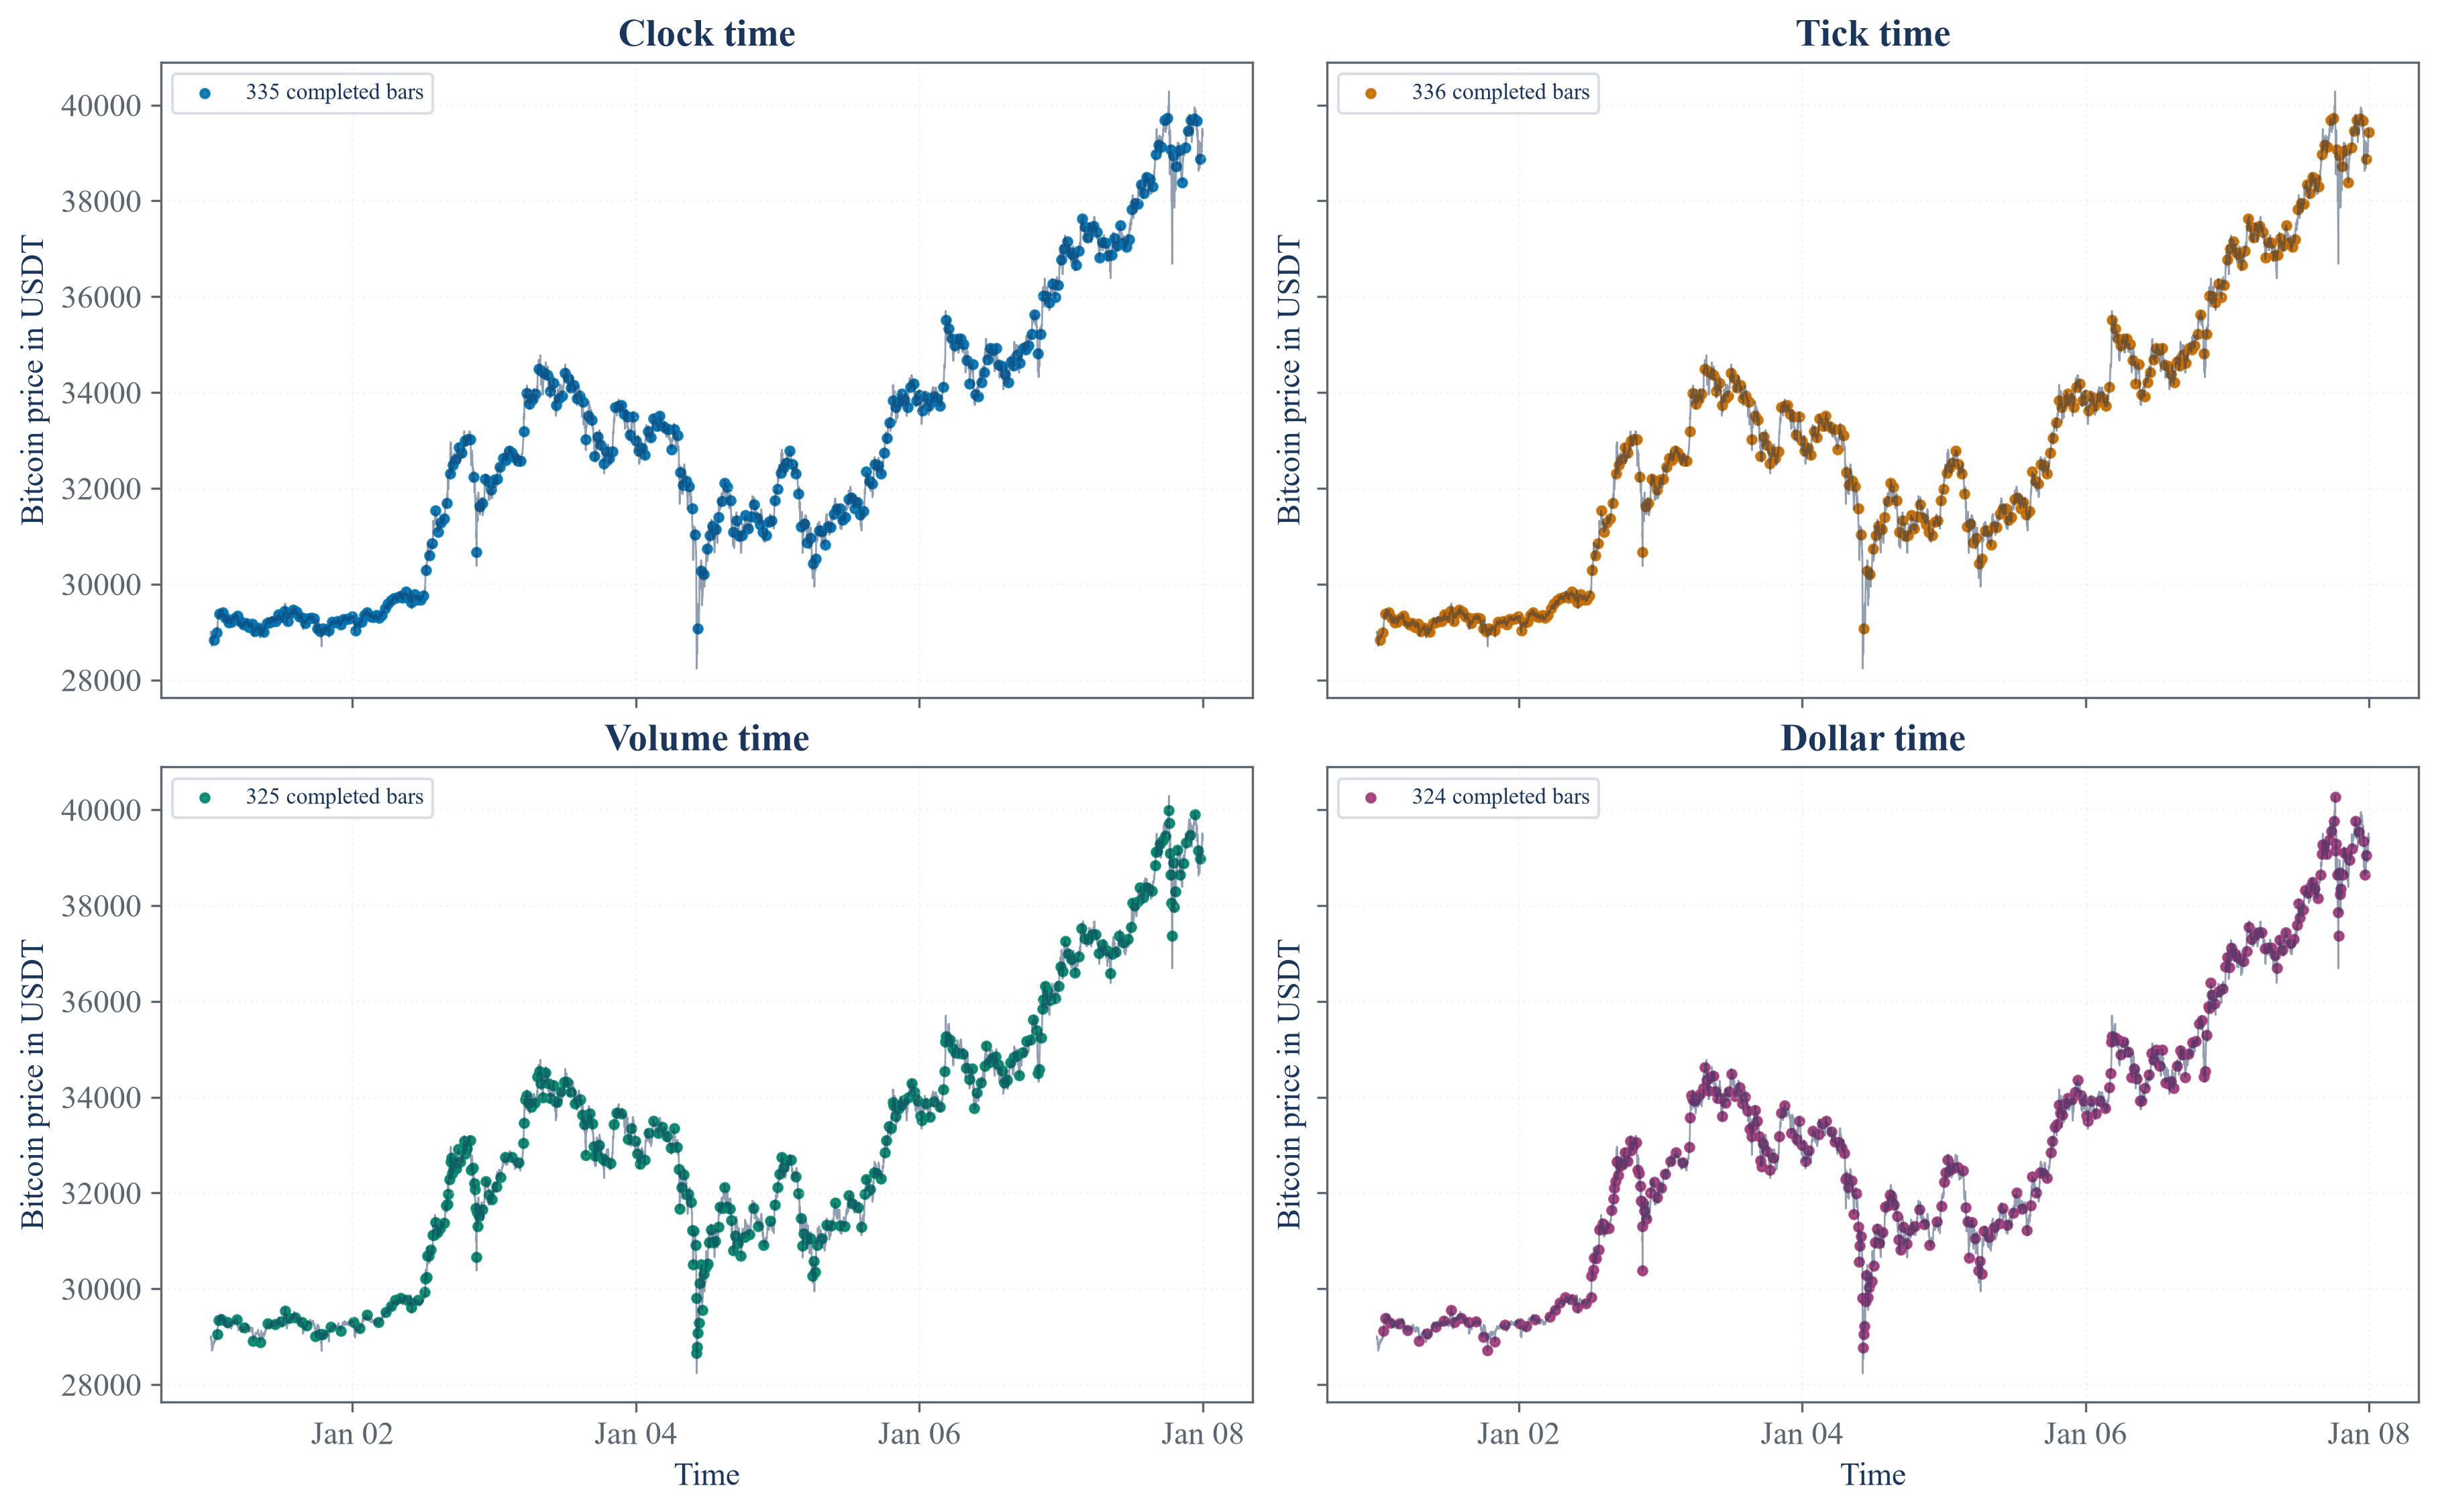
The same records produce different bar locations under clock, tick, volume, and dollar time. Activity-based clocks place more bars where trading is concentrated.
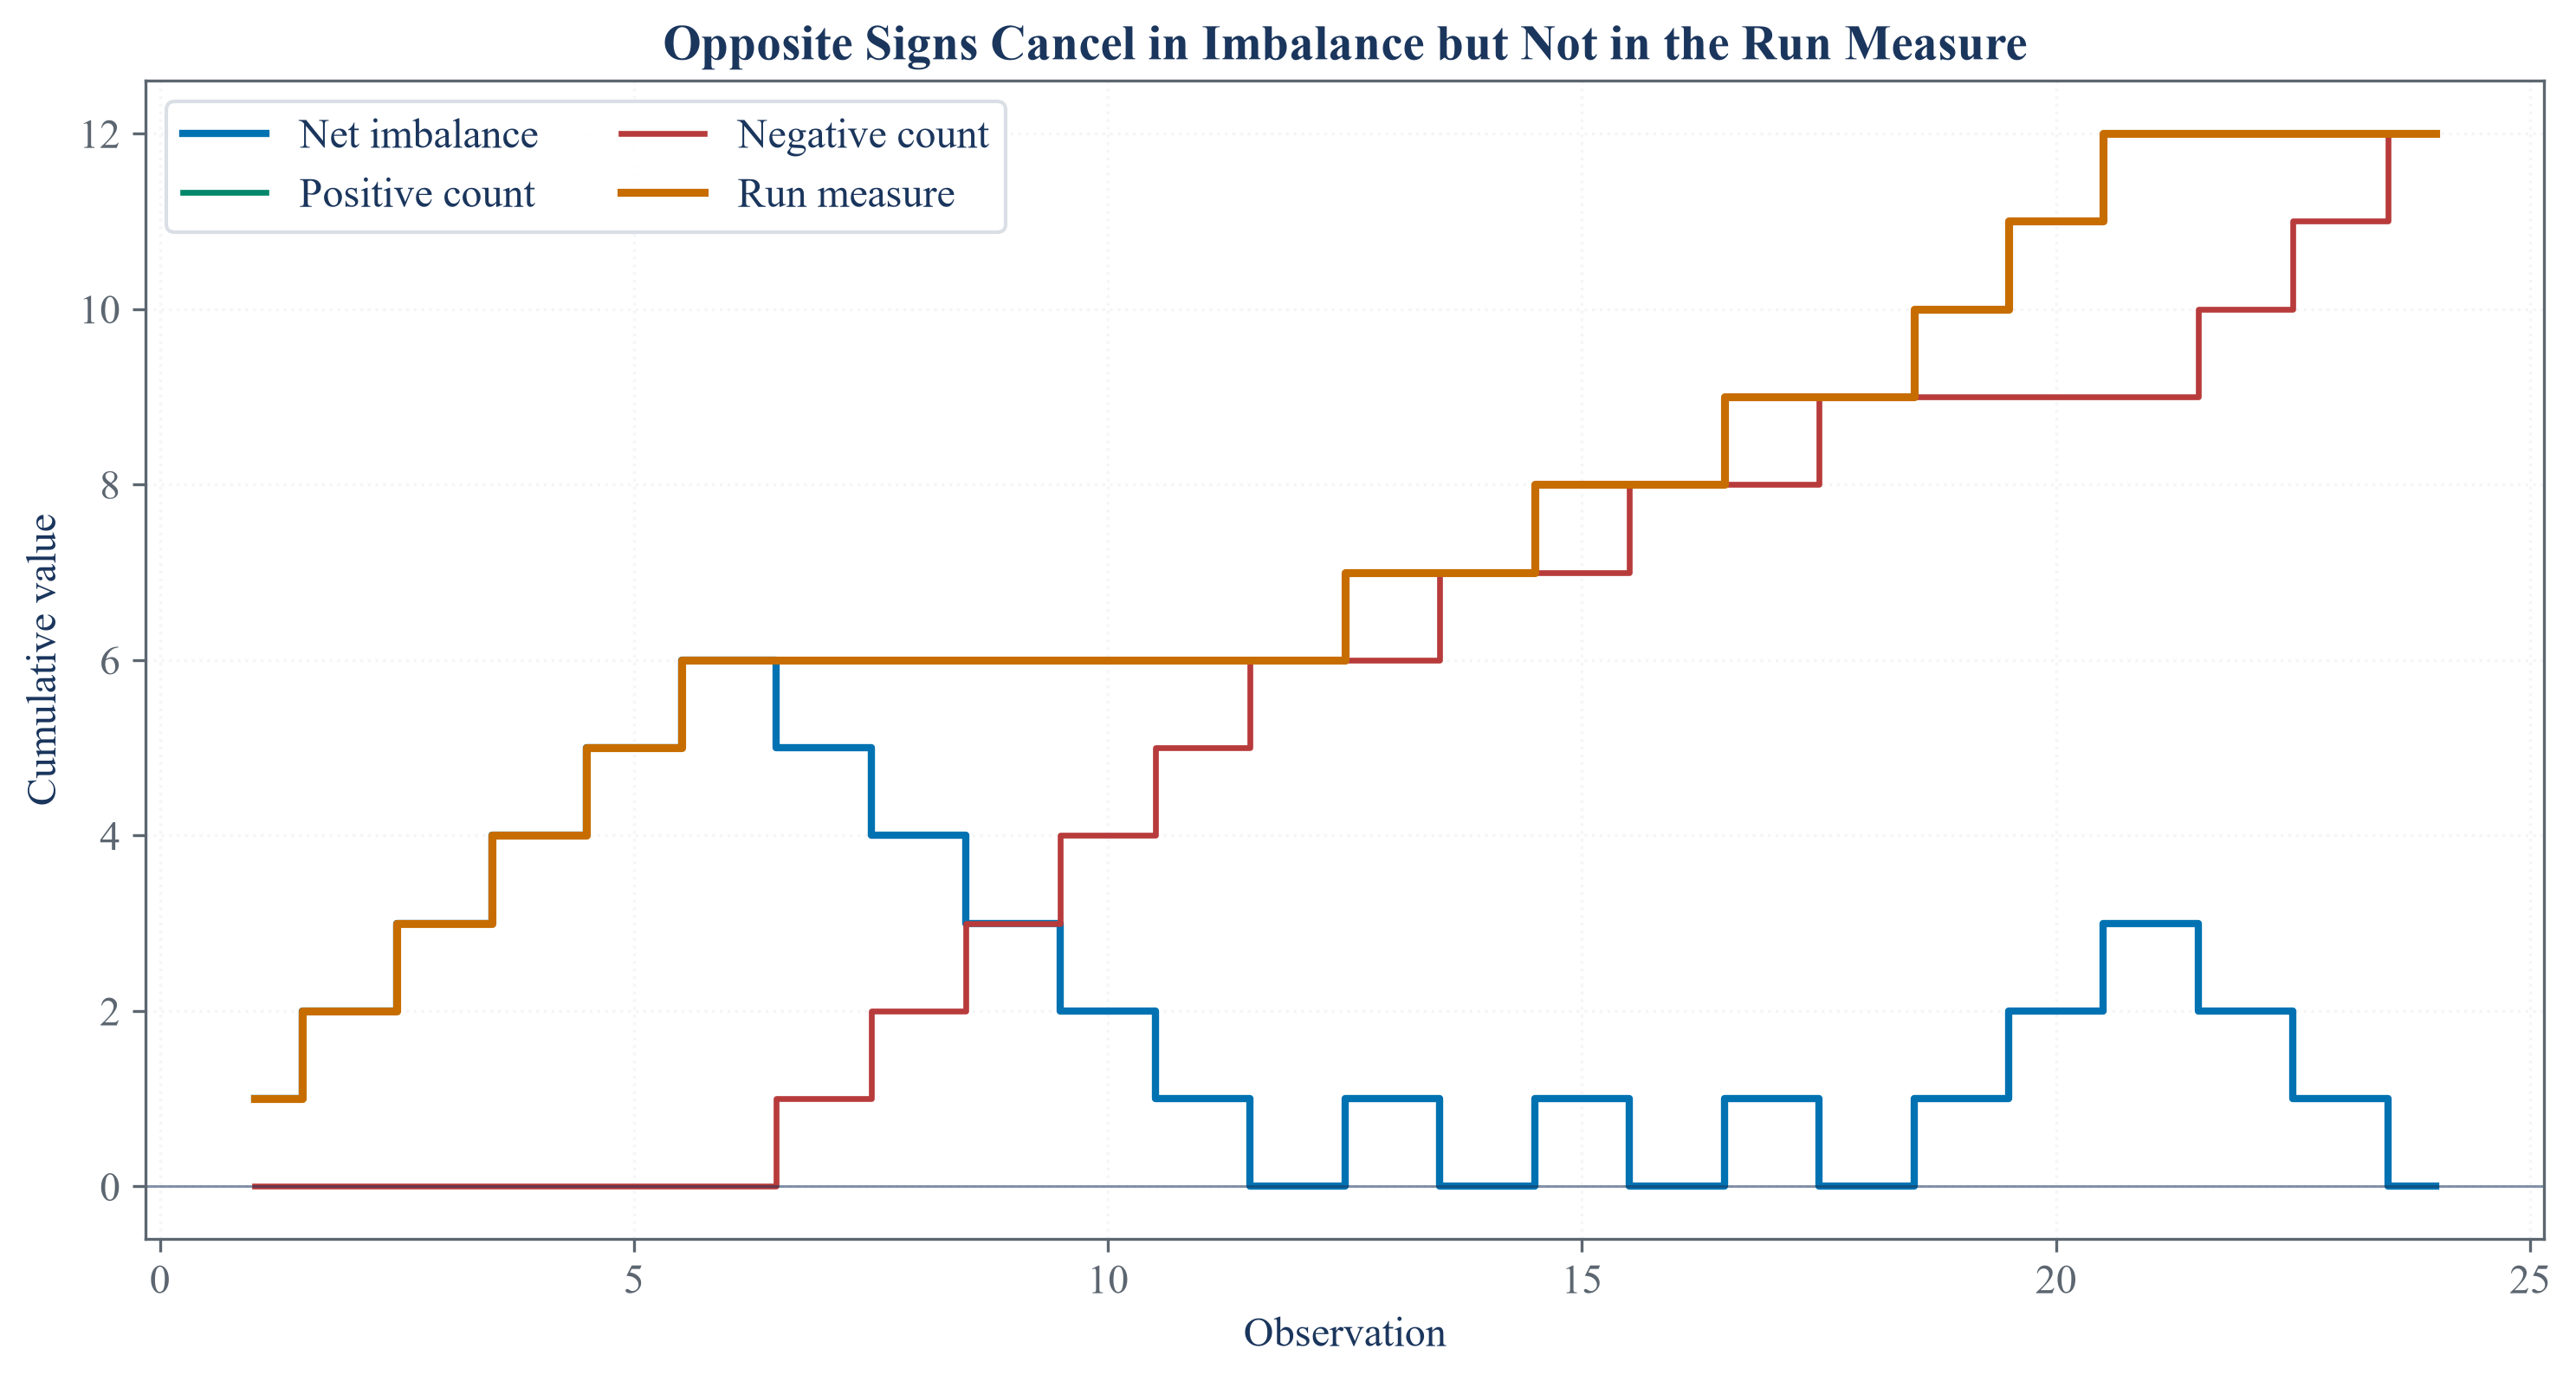
The paths show the evidence accumulated before each stopping rule closes a bar. The threshold and expected imbalance determine the resulting bar lengths.
Changing the clock changes the sample presented to every later method. It does not create information that was absent from the underlying record.
Notebooks
| 1. Choosing a financial clock |
| 2. Imbalance Bars as Stopping Times |
| 3. Sampling directional runs by information |