- Published on
Reading Causal Roles from Graphs
A graph is a compact statement about which variables may affect one another. These notebooks begin with small motifs, show how conditioning changes an open path, and then use public market data to illustrate what associations can and cannot establish.
The central relation
A directed acyclic graph is written as
is the set of variables, and is the set of directed arrows between them. An arrow records a proposed direct causal relation. The no-cycle condition means that following arrows cannot lead back to the starting variable.
How conditioning changes causal paths
The first figure compares the elementary structures that create common-cause, mediation, and collider paths. The public-data screen then shows how conditioning changes observed associations without claiming that correlation alone determines arrow direction.
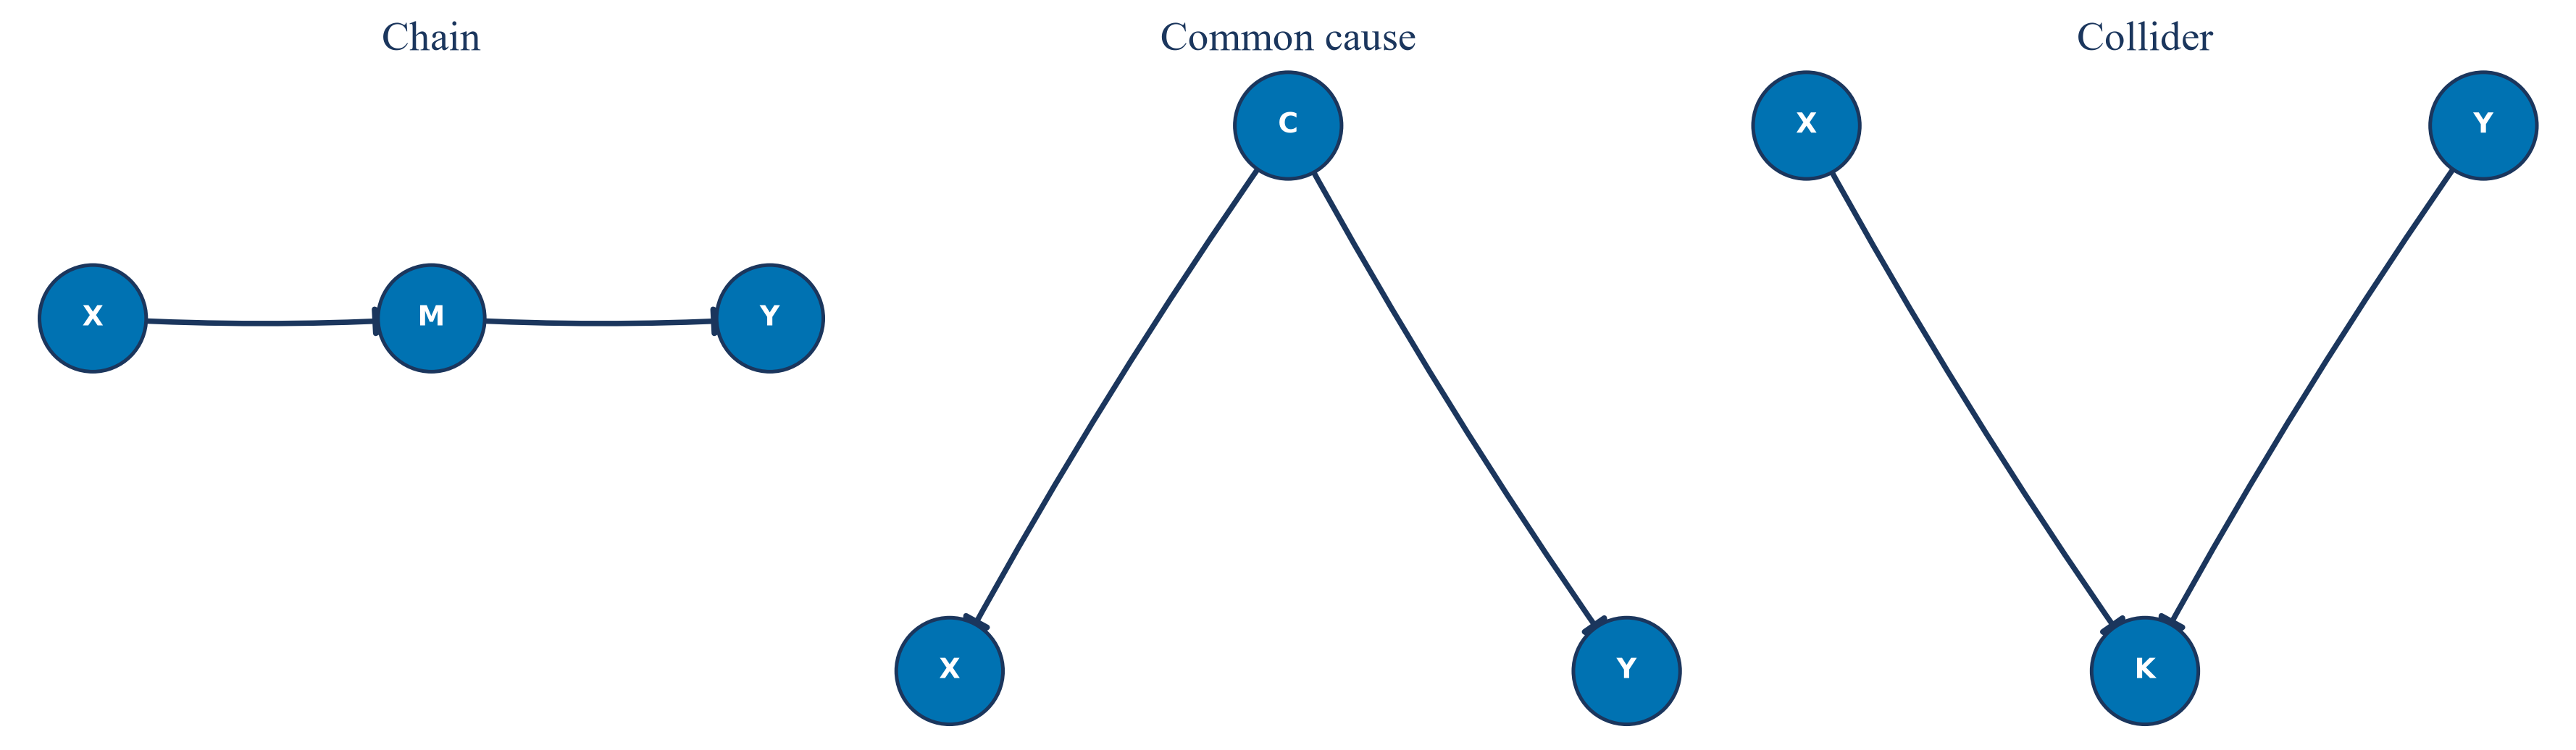
The same three variables can carry different causal roles. Whether conditioning blocks or opens a path depends on the arrows, not on the variable names.
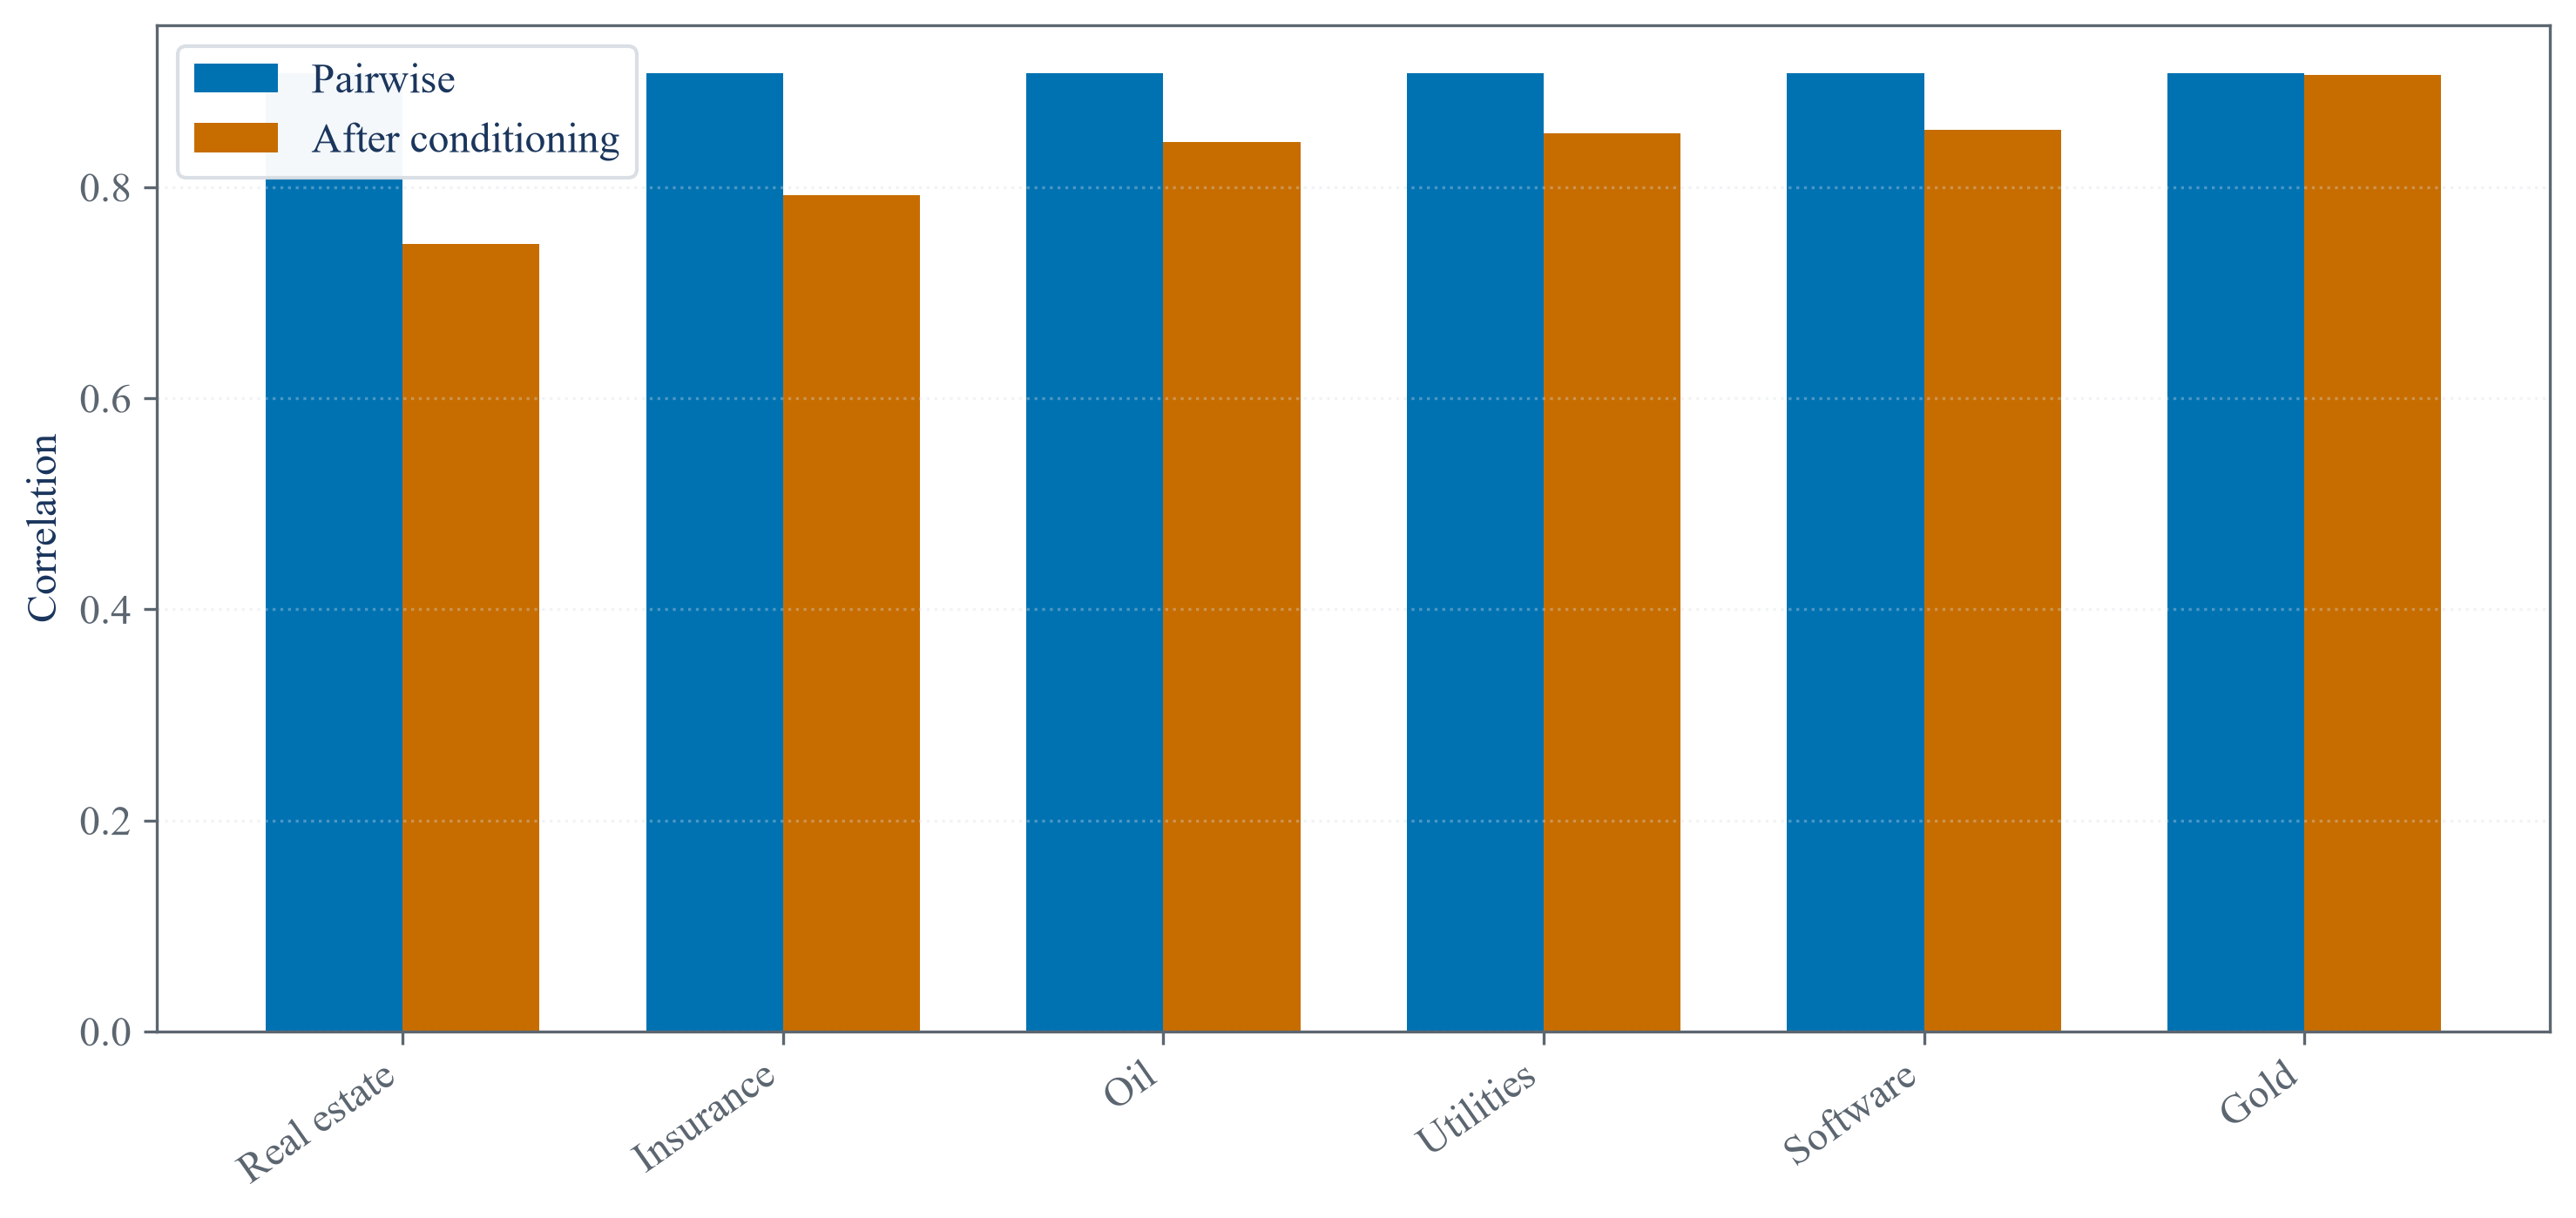
The public-data screen records how selected associations change after conditioning. It is a diagnostic view of the proposed graph, not evidence that the graph has been proved.
The graph encodes assumptions supplied by the analyst. Observational correlations can challenge those assumptions, but they usually cannot orient every arrow on their own.
Notebooks
| 1. Reading d-separation in directed acyclic graphs |
| 2. Distinguishing causal variable roles |
| 3. Classifying variable roles from graph paths |