- Published on
Managing Position Size under Performance Risk
A prediction becomes a financial decision only after it is mapped to a position. The notebooks study probability calibration, mean-reverting entry rules, transaction costs, and the drawdown behavior of the resulting path.
The central relation
A score can be mapped to a calibrated probability by
is the calibrated probability of the positive outcome. The coefficients and set the slope and location of the sigmoid and are estimated on observations separate from those used to fit the original predictor.
From signal calibration to portfolio drawdown
The reliability plot checks whether predicted probabilities match observed frequencies. The wealth and drawdown plot shows the consequence of the complete sizing rule on public observations.
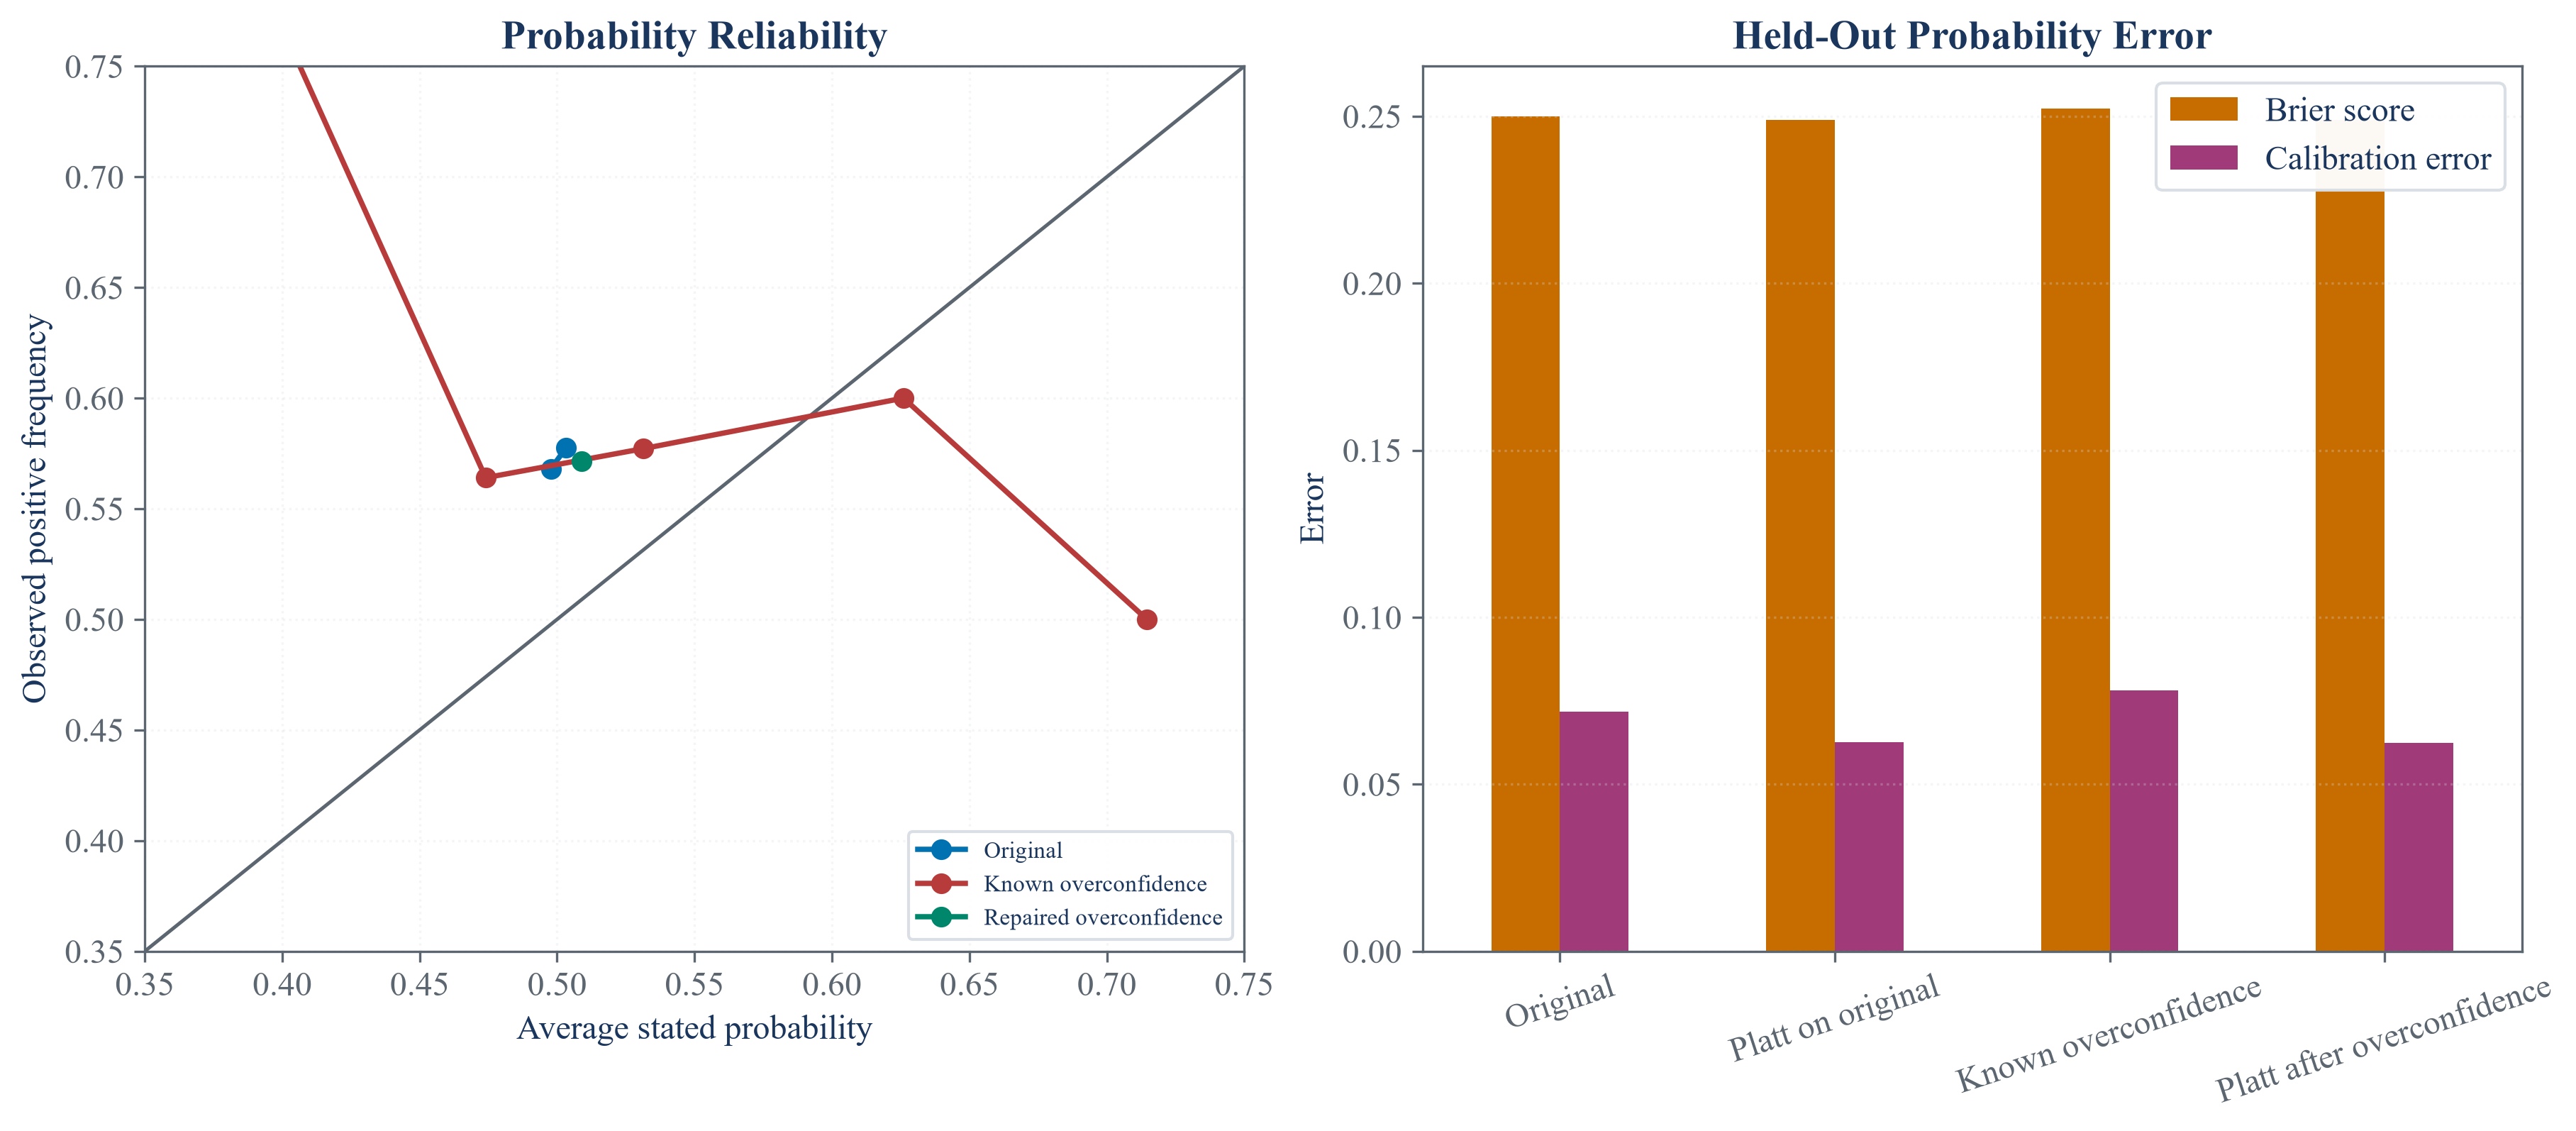
A calibrated signal should place events with similar predicted probabilities into groups with similar observed frequencies.
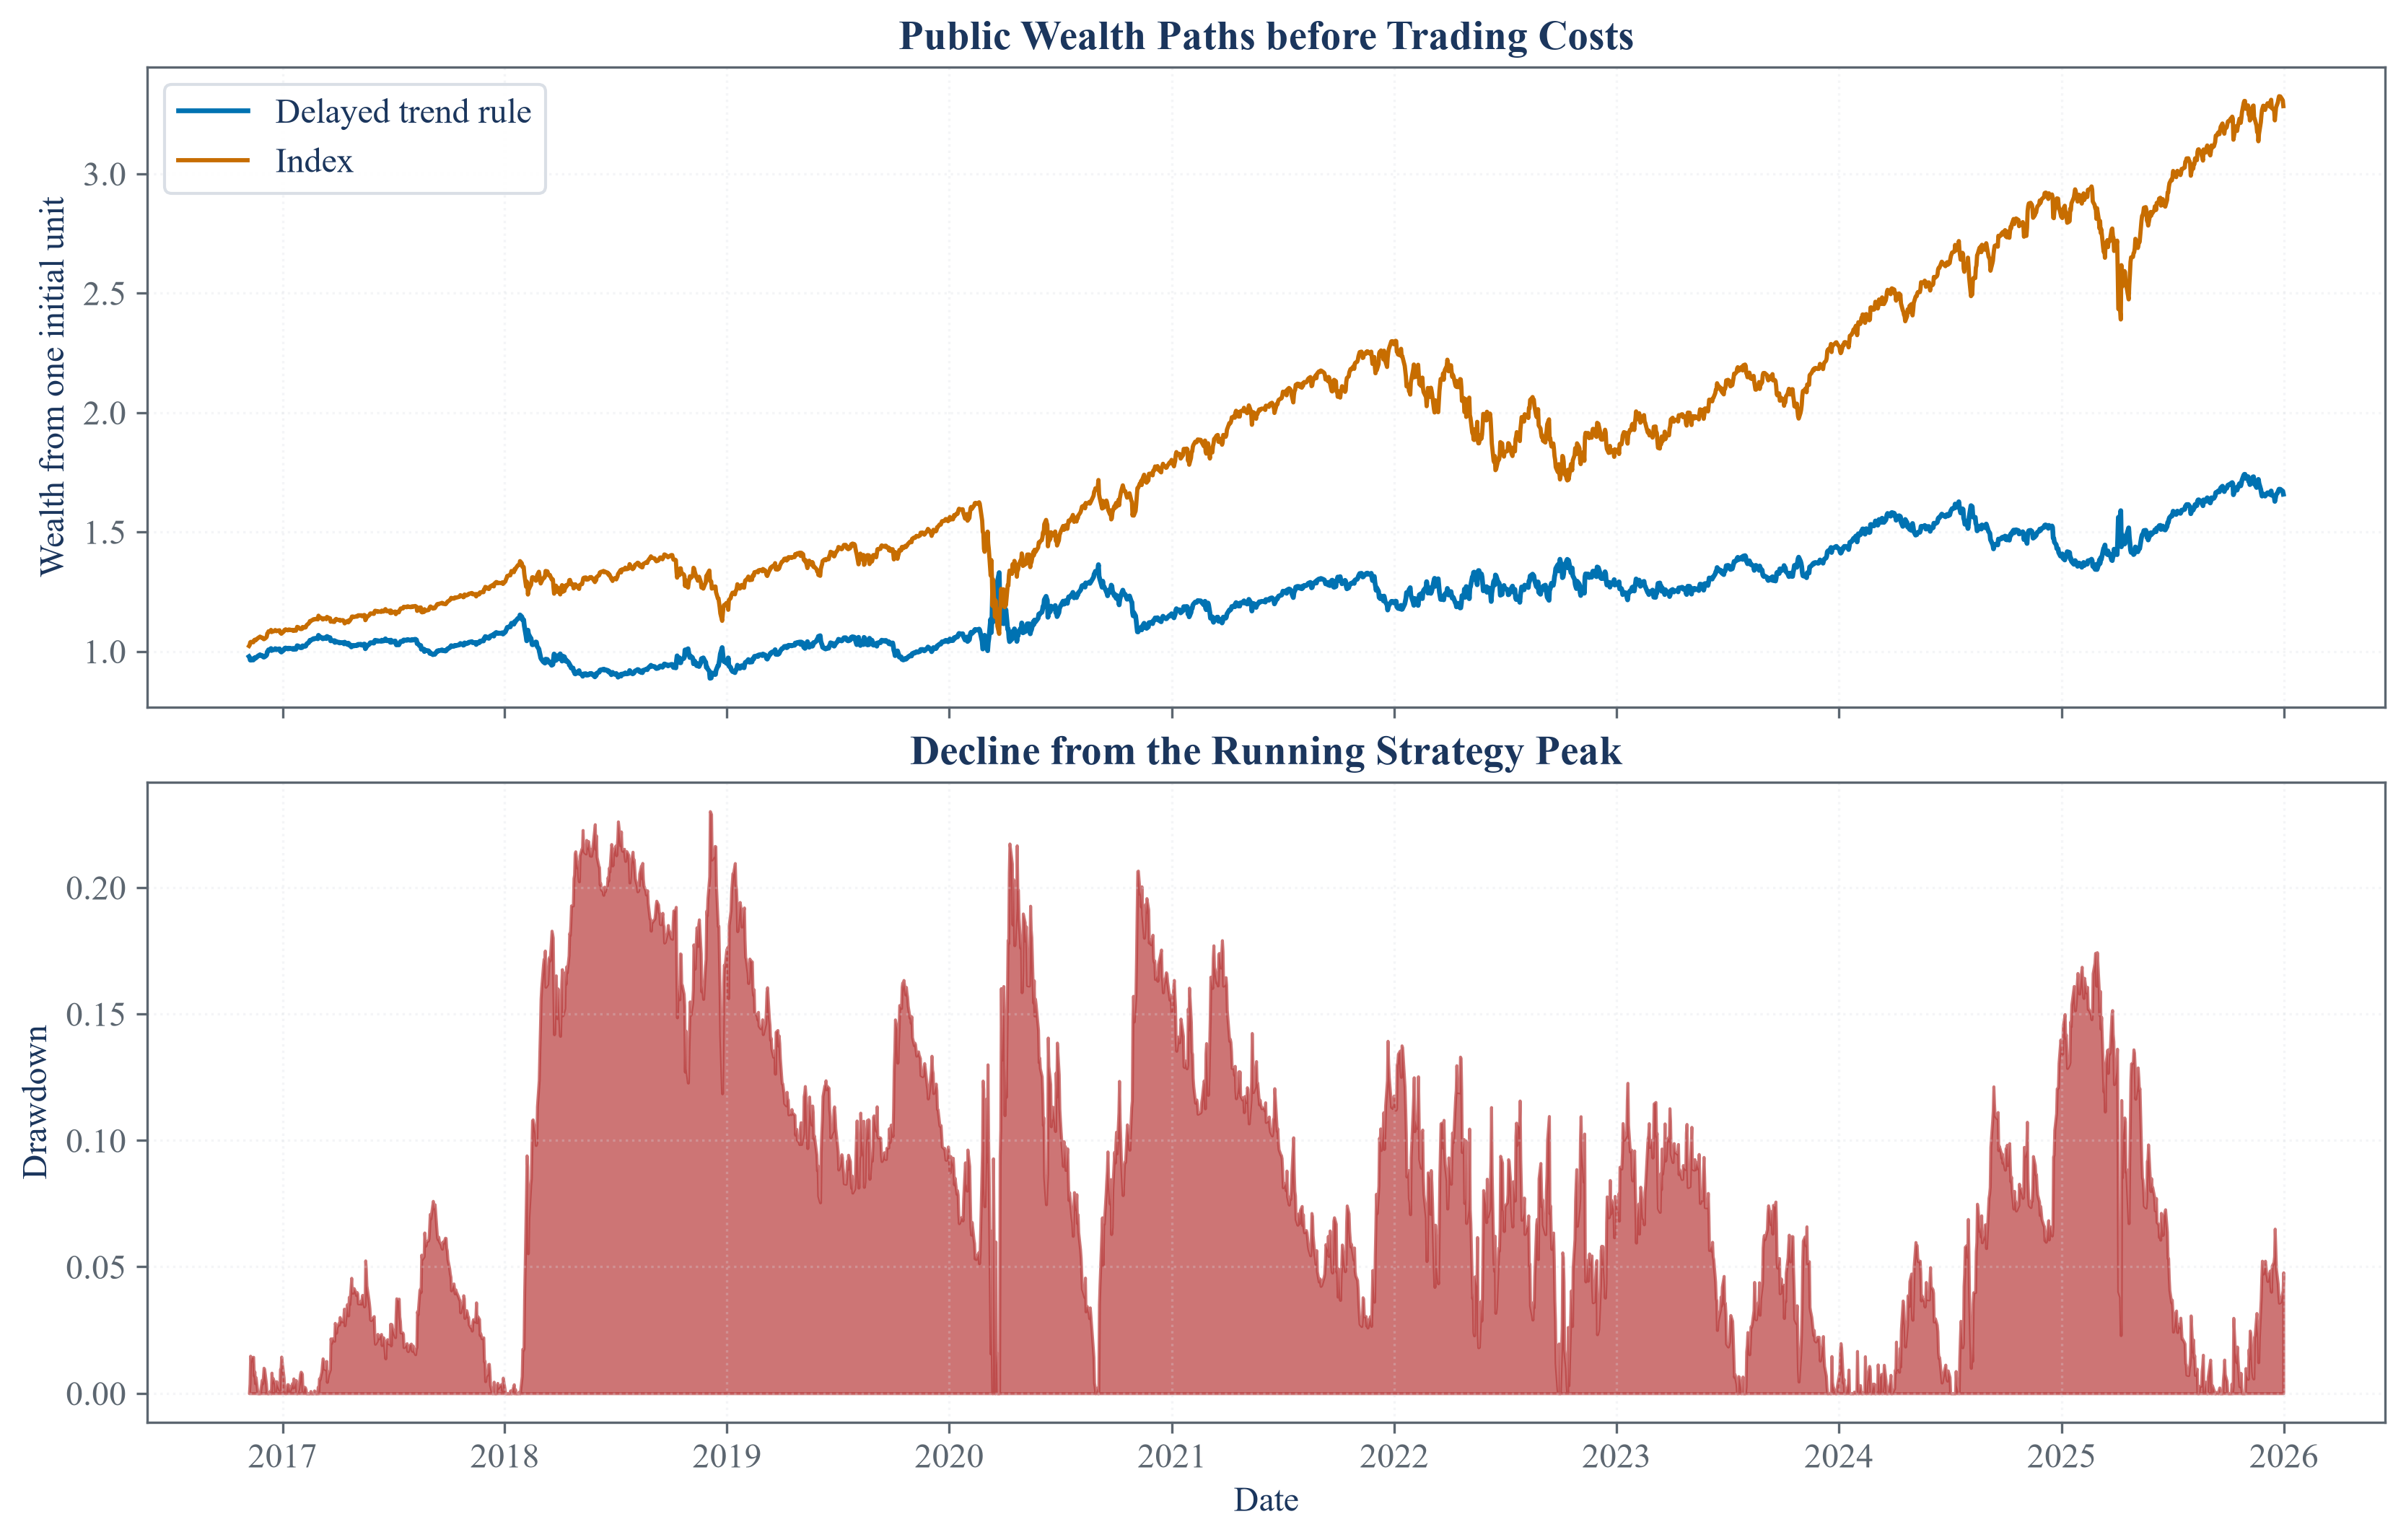
The path reports both cumulative value and losses from prior peaks, keeping adverse periods visible beside aggregate performance.
Calibration and sizing are evaluated as one declared rule. A favorable historical path is not evidence that the same rule will retain its edge.
Notebooks
| 1. Mapping calibrated signals to positions |
| 2. Choosing barriers for a mean-reverting strategy |
| 3. Measuring strategy risk from a return path |