- Published on
Weighting Samples with Overlapping Information
Two labeled observations can share much of the same price history. Treating them as independent gives repeated information too much influence. The notebooks measure this overlap and compare weighting and sampling rules.
The central relation
For event interval , concurrency is
equals one when event is active at time . The start and end times are and , is the number of events, and counts how many events use information from time .
Measuring repeated information across event labels
The concurrency plot shows where labels reuse the same return intervals. The sampling comparison shows how sequential selection changes the uniqueness of the chosen sample.
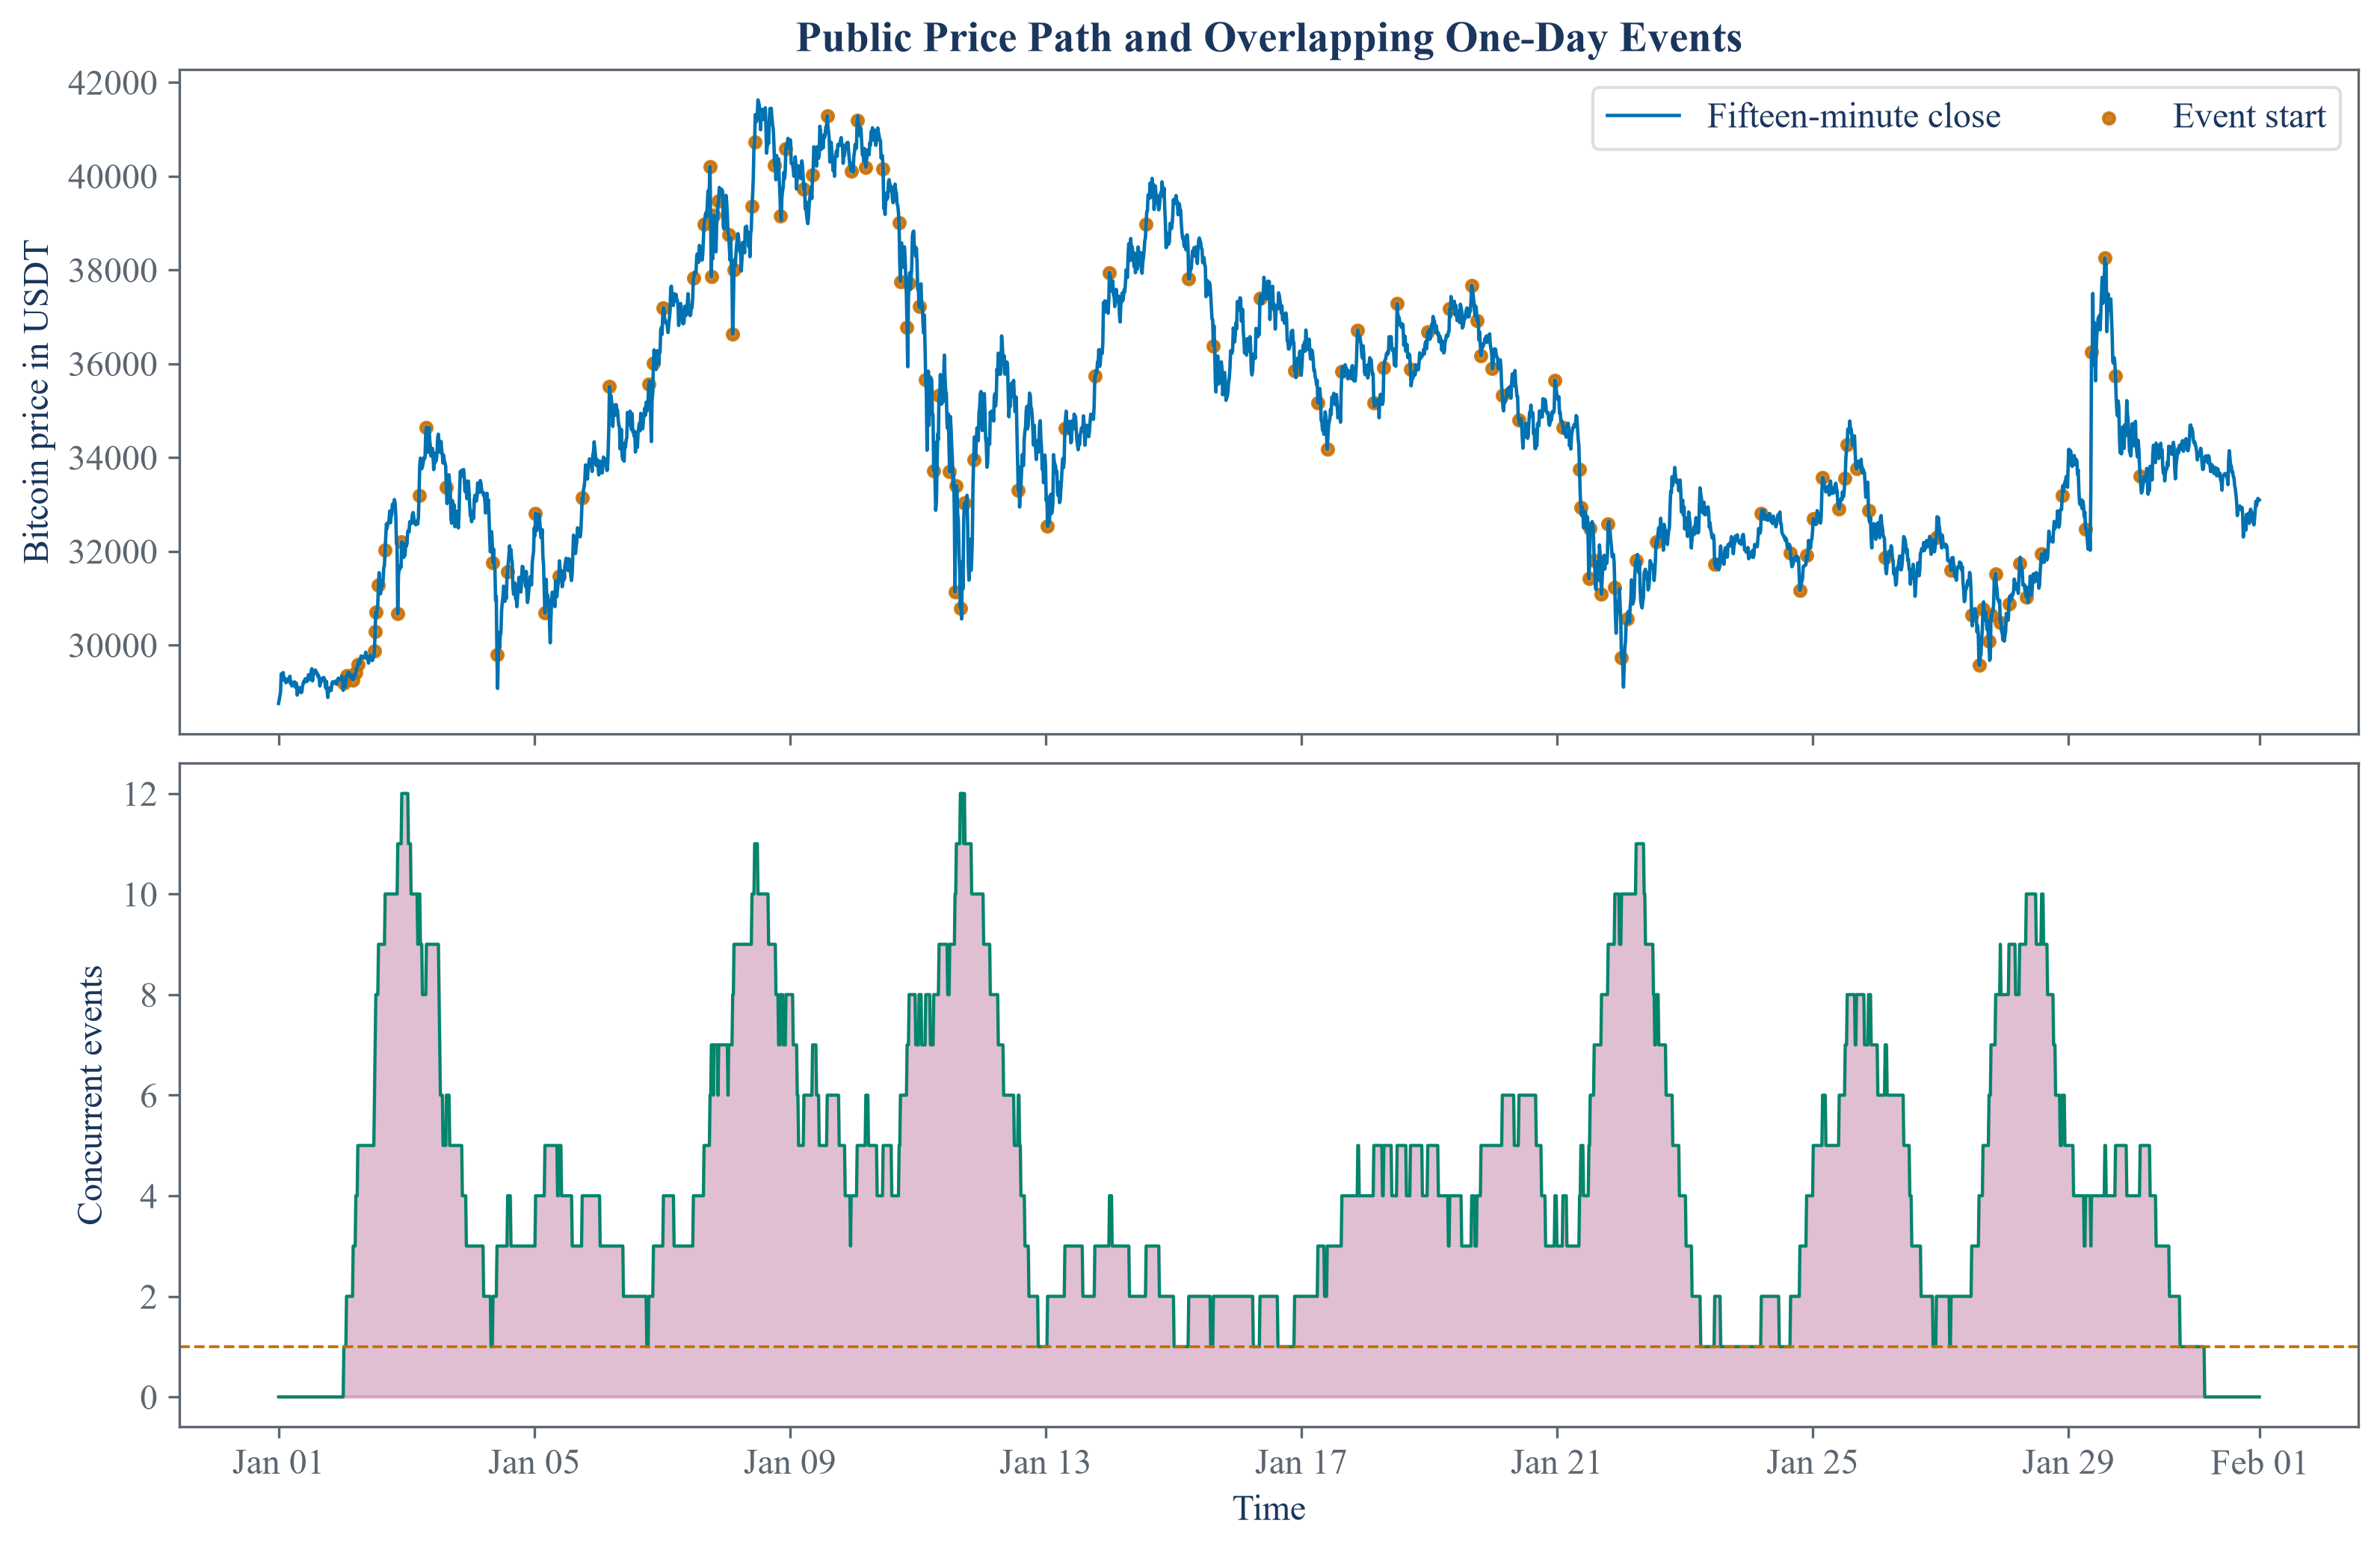
Concurrency rises when many event horizons cover the same dates. Those periods contribute repeated information to several labels.
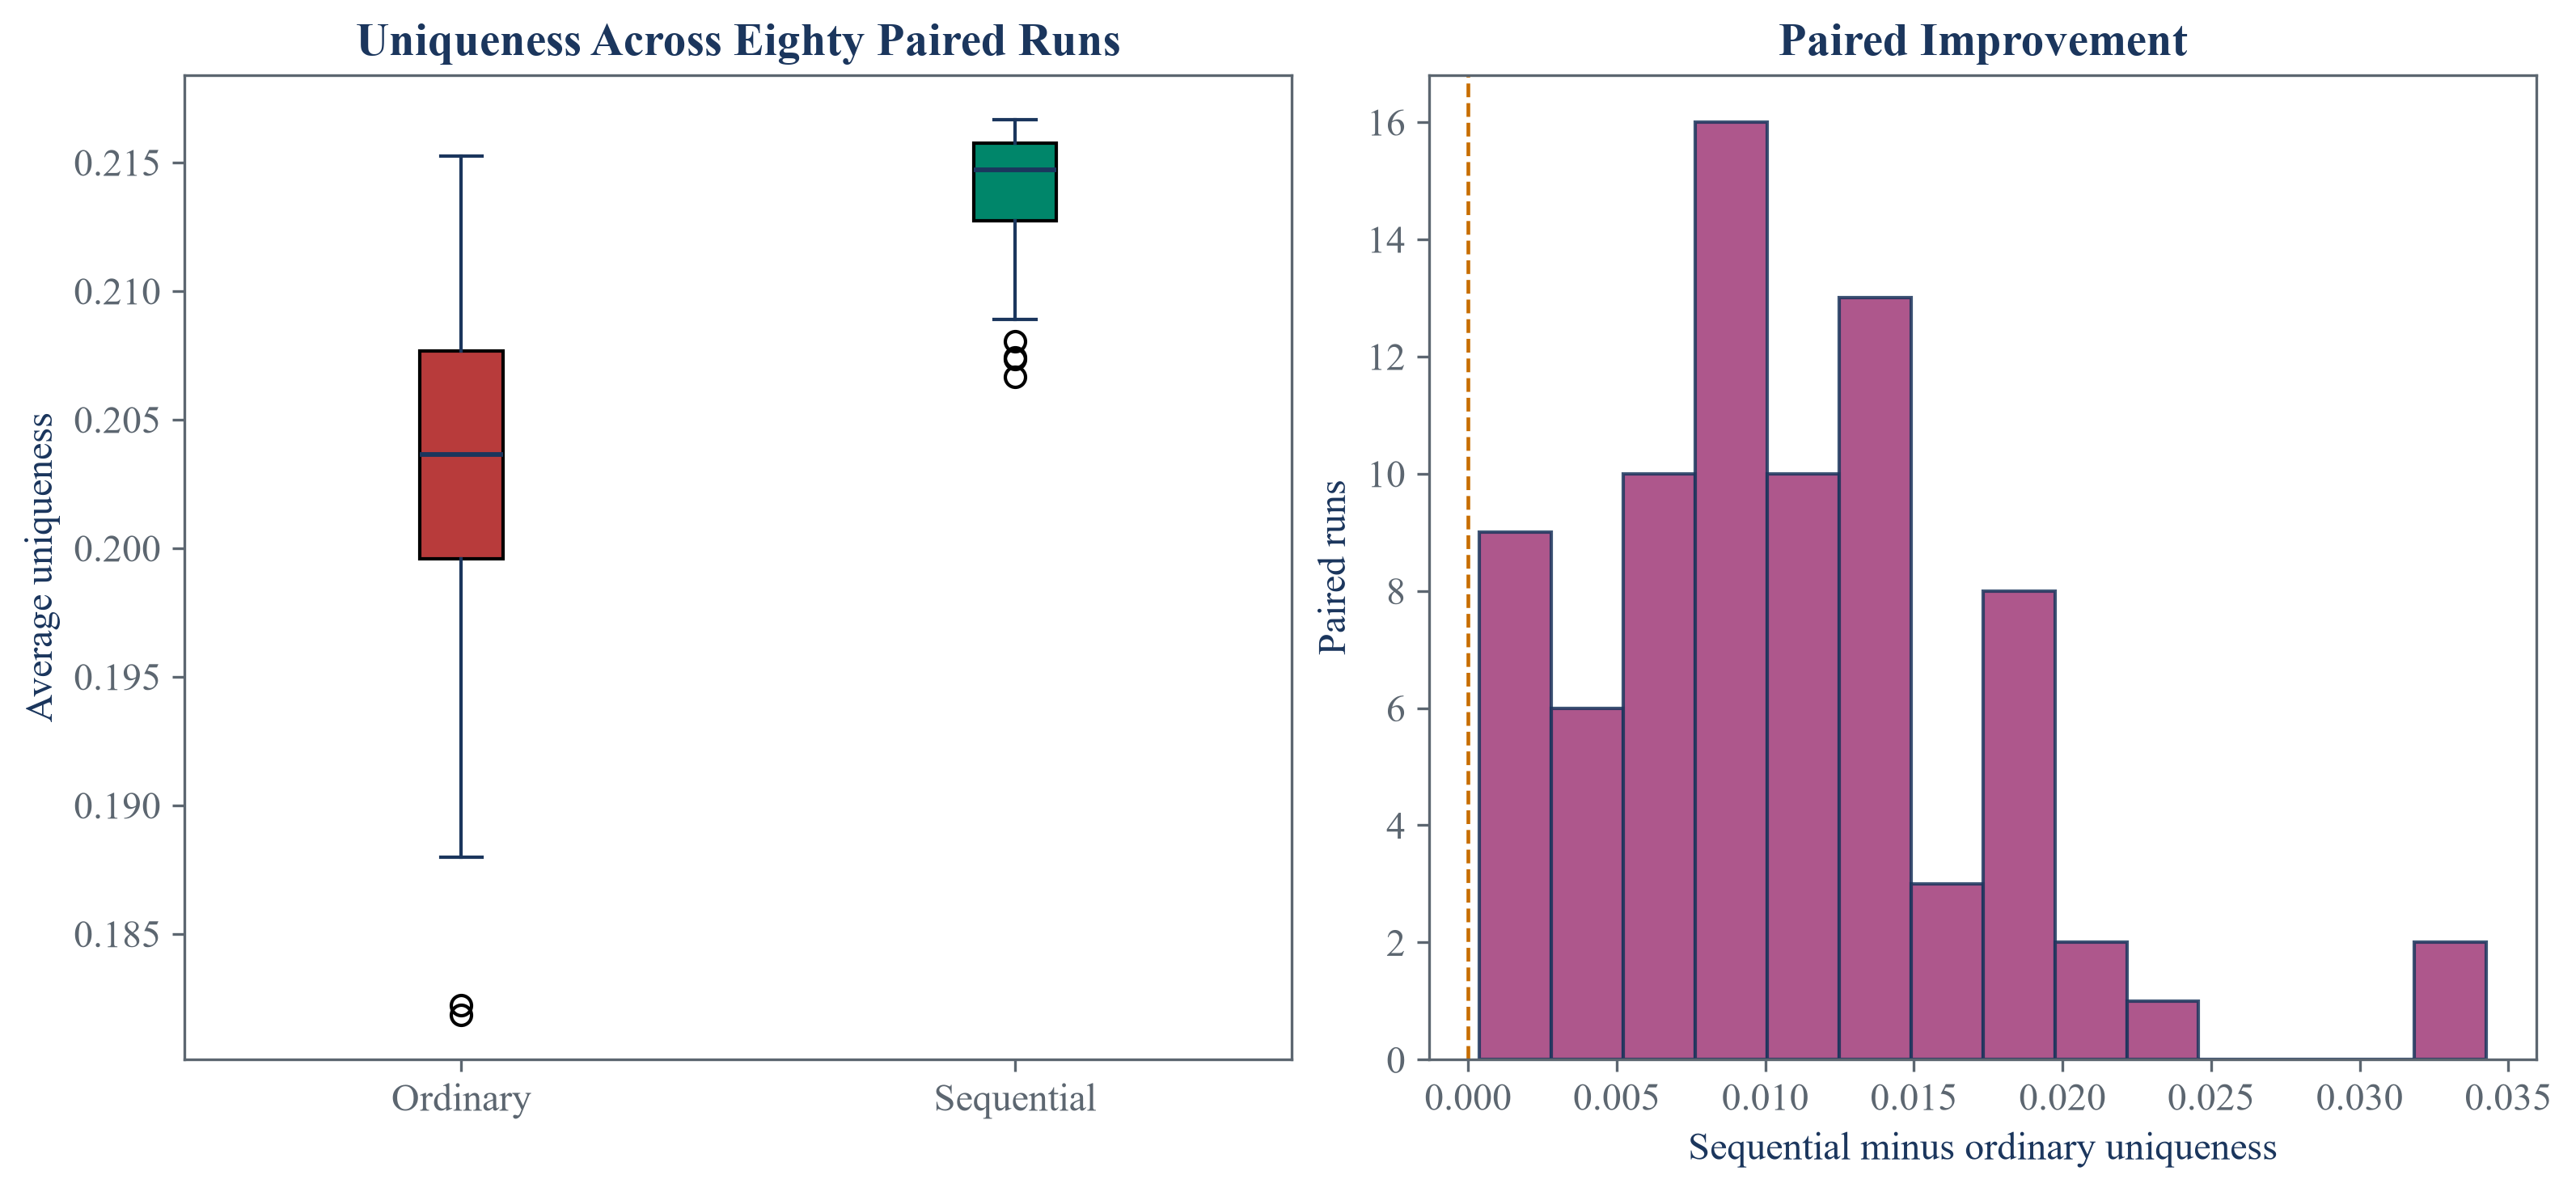
Sequential sampling favors observations that add information not already represented in the current draw. The comparison reports the resulting uniqueness rather than assuming independence.
Weights and sequential sampling reduce the influence of duplicated intervals, but they do not remove every form of dependence in financial observations.
Notebooks
| 1. Measuring overlap through event concurrency |
| 2. Weighting returns by average uniqueness |
| 3. Managing overlap with weights and sequential sampling |