- Published on
Sensitivity Analysis under Partial Identification
Sometimes the data and credible assumptions determine a range rather than one causal effect. These notebooks calculate that range, examine which additional assumptions narrow it, and show when even the sign of the effect remains uncertain.
The central relation
When every outcome lies between and , the sample average effect lies between
is the observed outcome for unit , equals one for treatment and zero otherwise, and is the sample size. The constants and are the lowest and highest possible outcomes. The quantities and are the least and greatest average effects consistent with those outcome limits alone.
What weaker assumptions allow us to conclude
The exact example shows how much uncertainty remains when only the outcome range is assumed. The sensitivity map then records where added assumptions preserve or reverse the sign of the estimated effect.
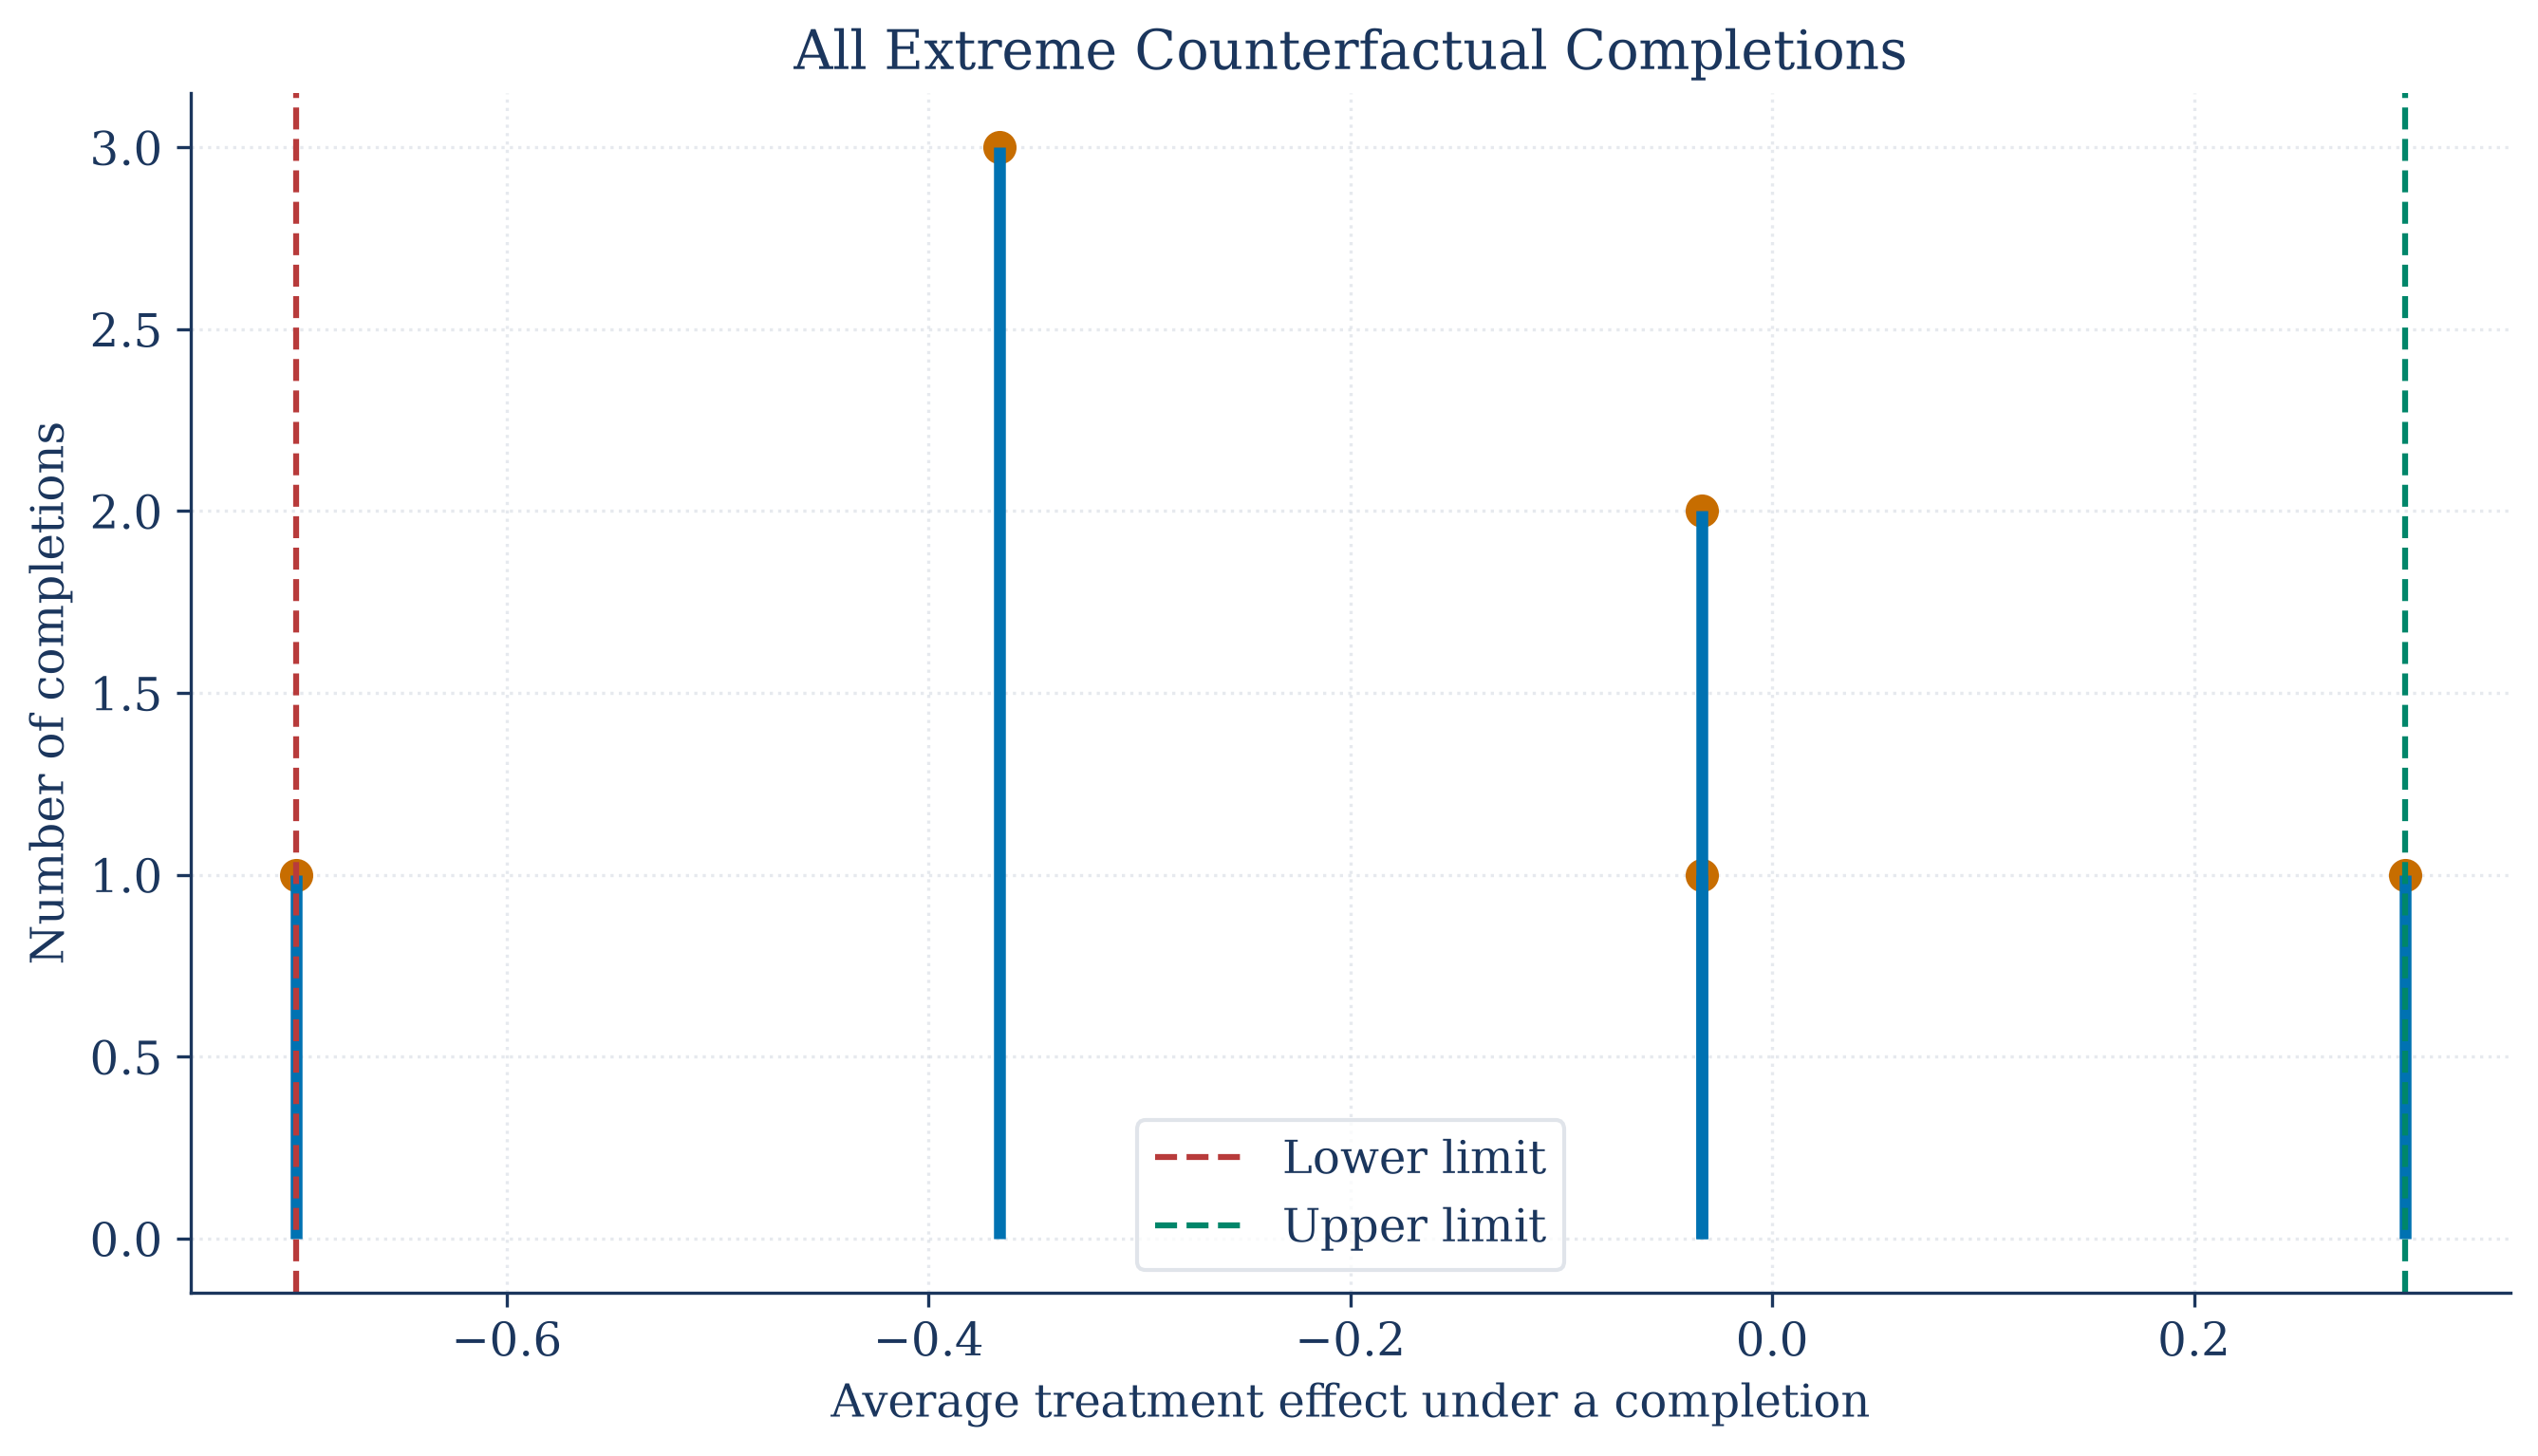
The observed groups leave each missing potential outcome unknown within the stated outcome range. The resulting interval describes identification uncertainty, not sampling uncertainty.
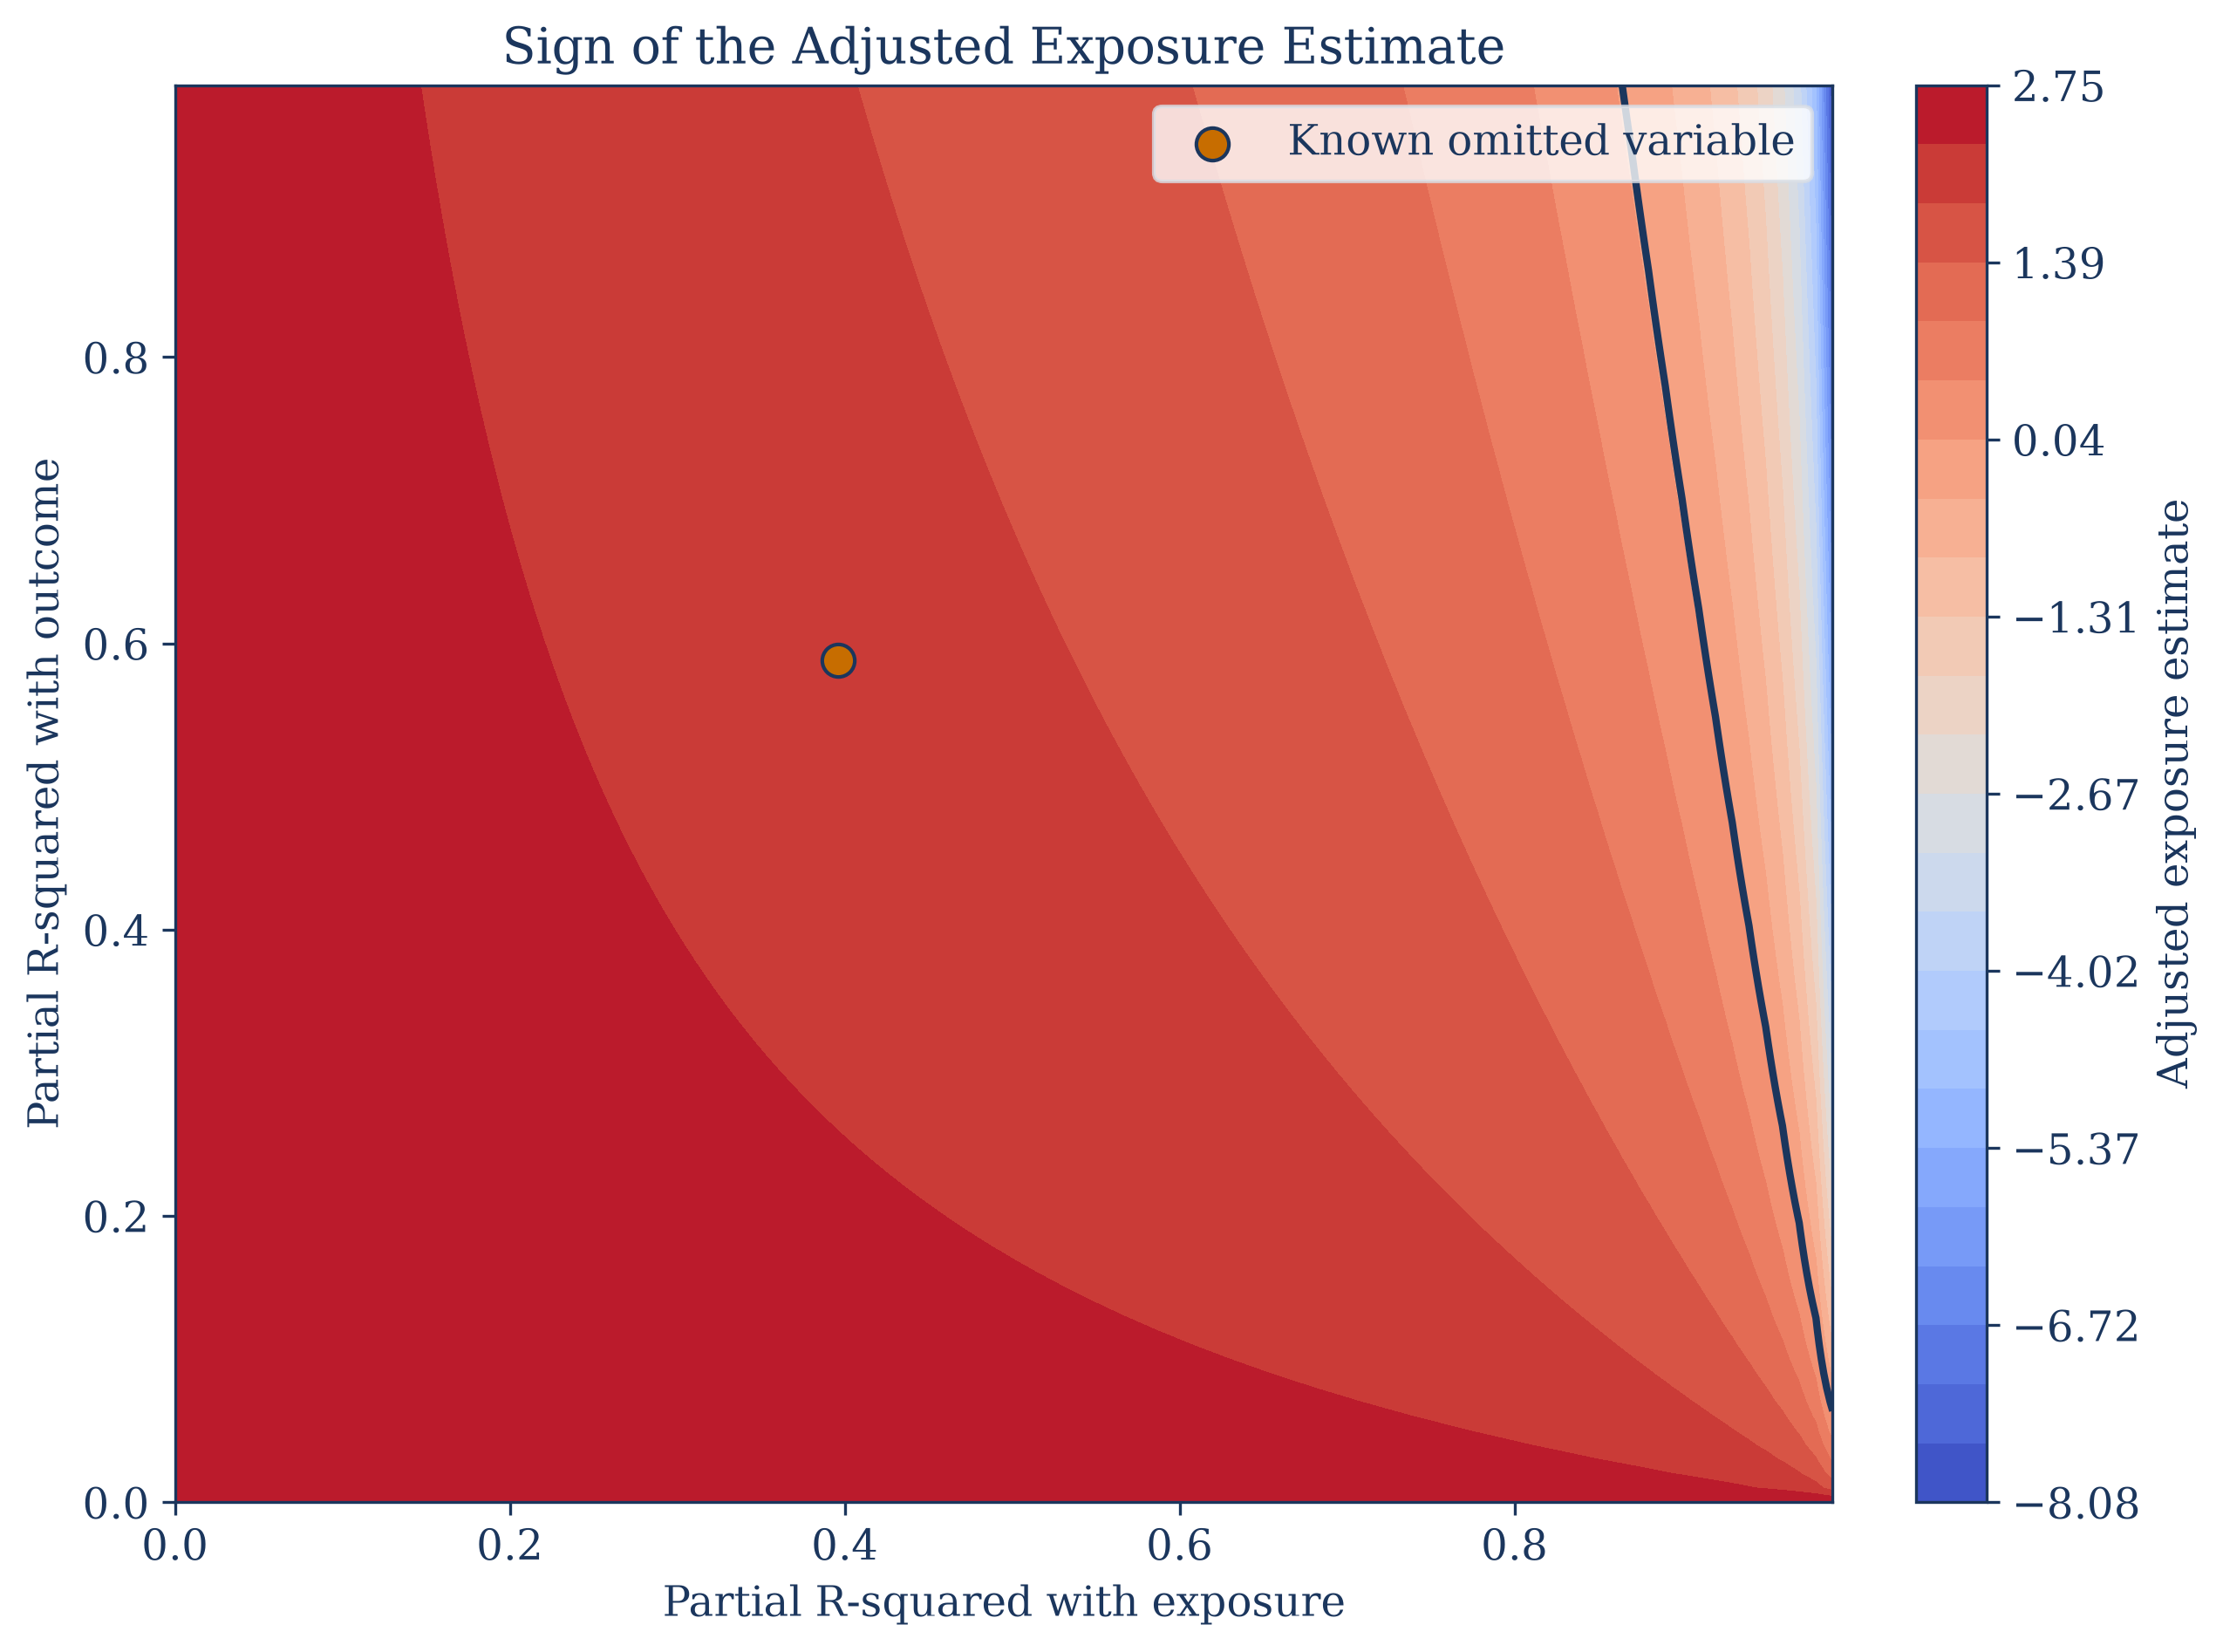
The map shows which combinations of sensitivity assumptions preserve the sign of the effect and which leave the sign unresolved.
An identification interval is not a confidence interval. It describes what the data and assumptions permit, while a confidence interval describes sampling uncertainty around an identified target.
Notebooks
| 1. Bounds from Observed Outcomes |
| 2. Regression Sensitivity |
| 3. How assumptions narrow the effect region |