- Published on
A Research Protocol for Causal Factor Investing
A credible factor study needs more than a final return curve. These notebooks assemble the graph, estimand, validation design, search record, allocation rule, and reporting checks into one sequence so that a failure remains visible rather than being hidden by a later result.
The central relation
The ordered research record is represented by
is the complete protocol, and denotes stage . The stages cover the causal question, graph, identification, estimation, validation, portfolio decision, and final report. The order prevents a later performance result from excusing an earlier design failure.
Tracing a causal claim from graph to portfolio
The stage diagram records the sequence and its stopping points. The public strategy result then shows the final comparison together with the adjustments and validation history needed to interpret it.
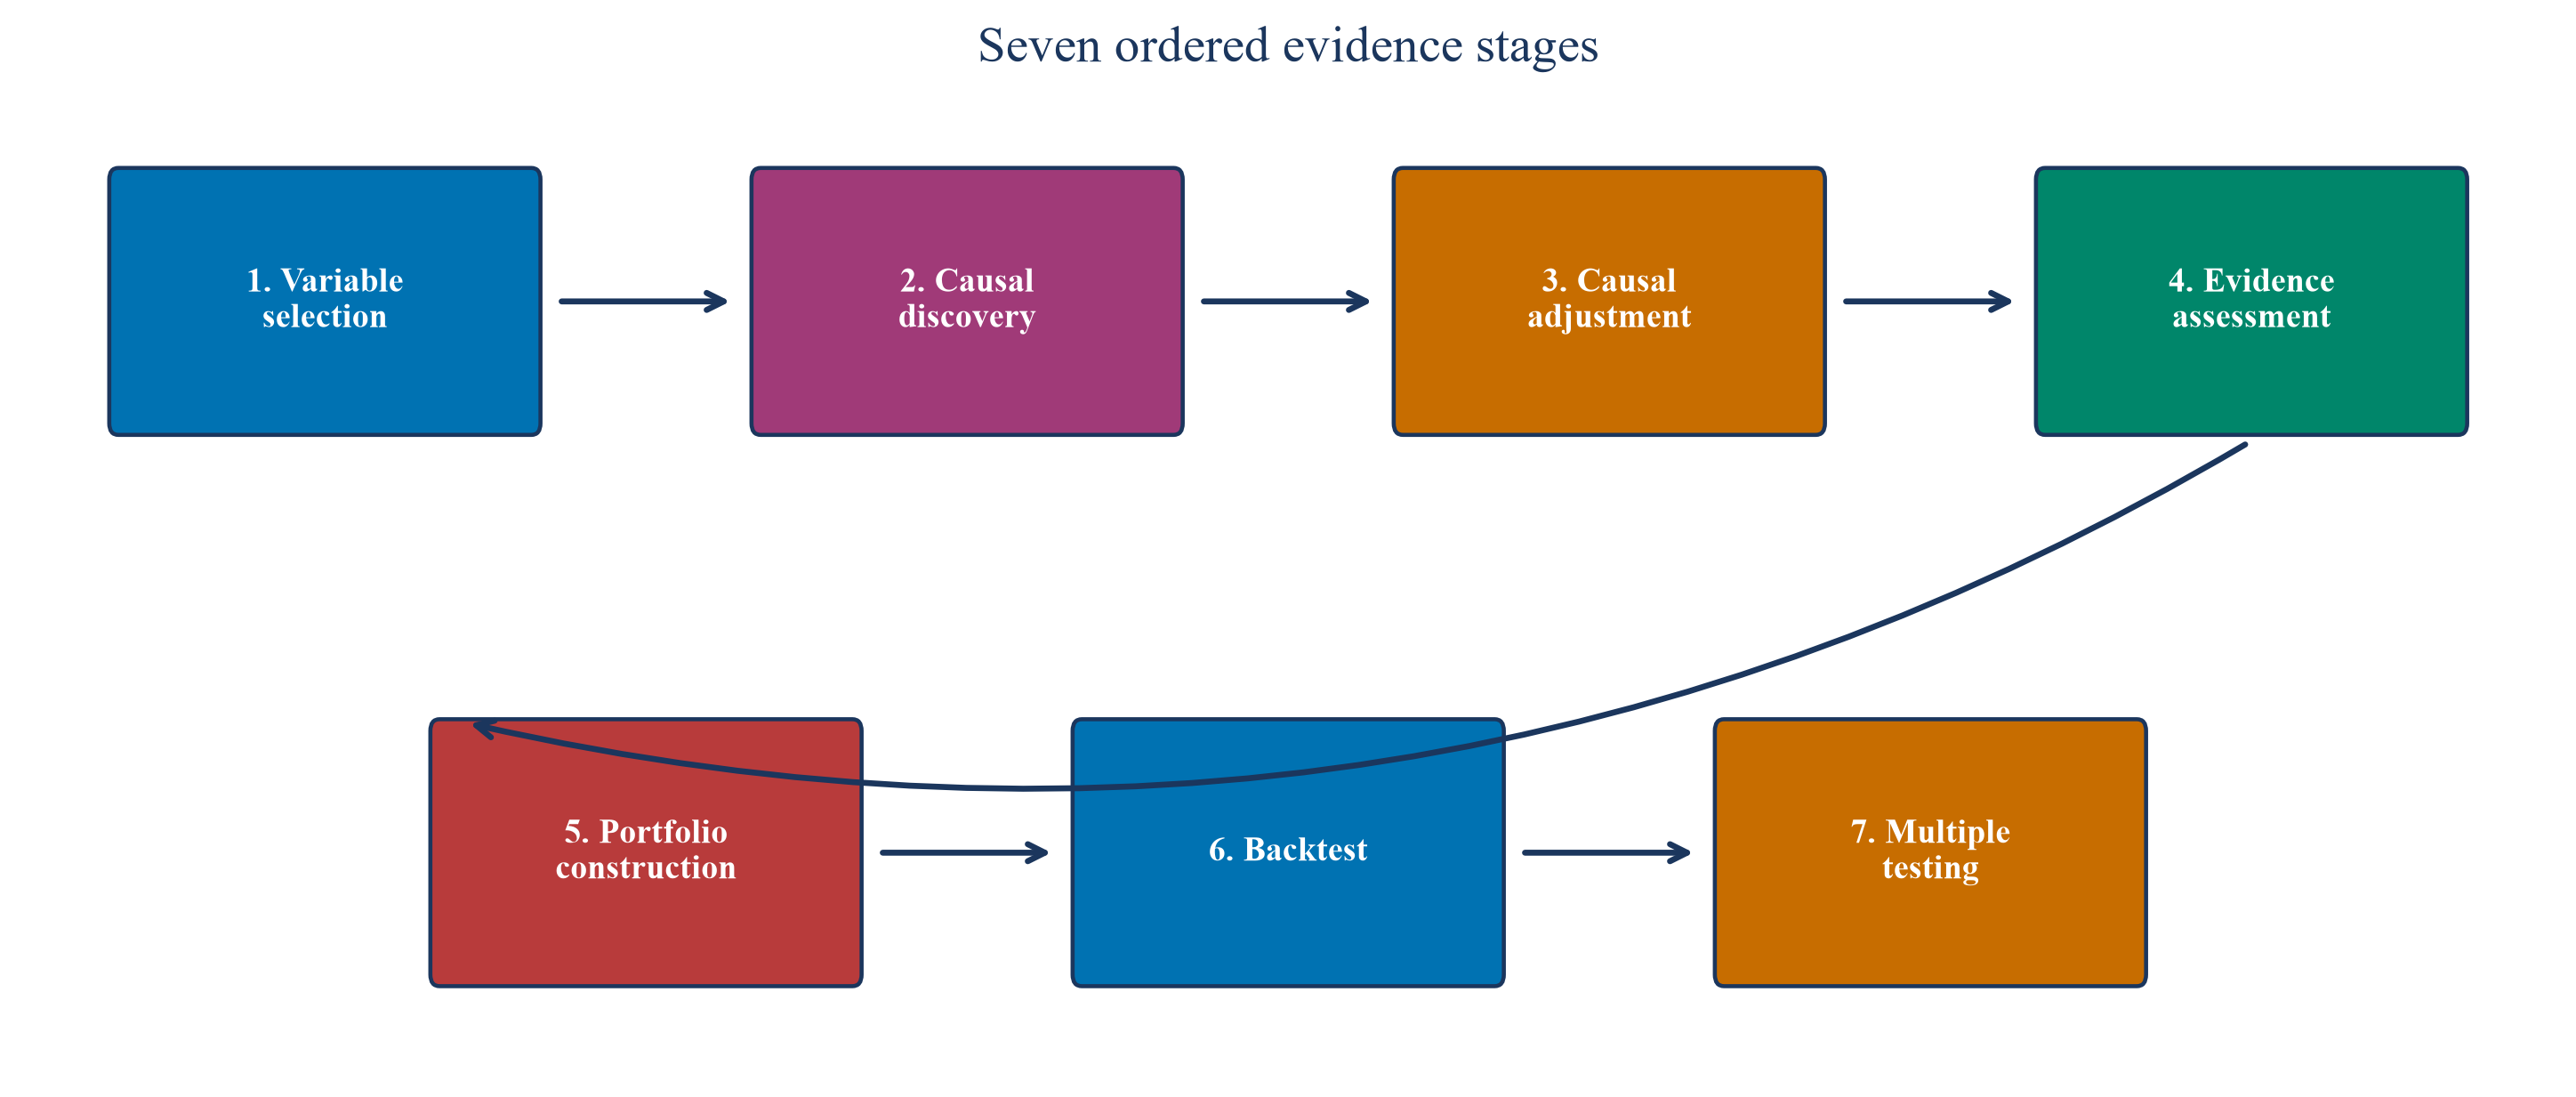
Each stage produces a record that can be checked before the study proceeds. A failed identification or validation check stops the sequence rather than becoming a footnote to the final return curve.
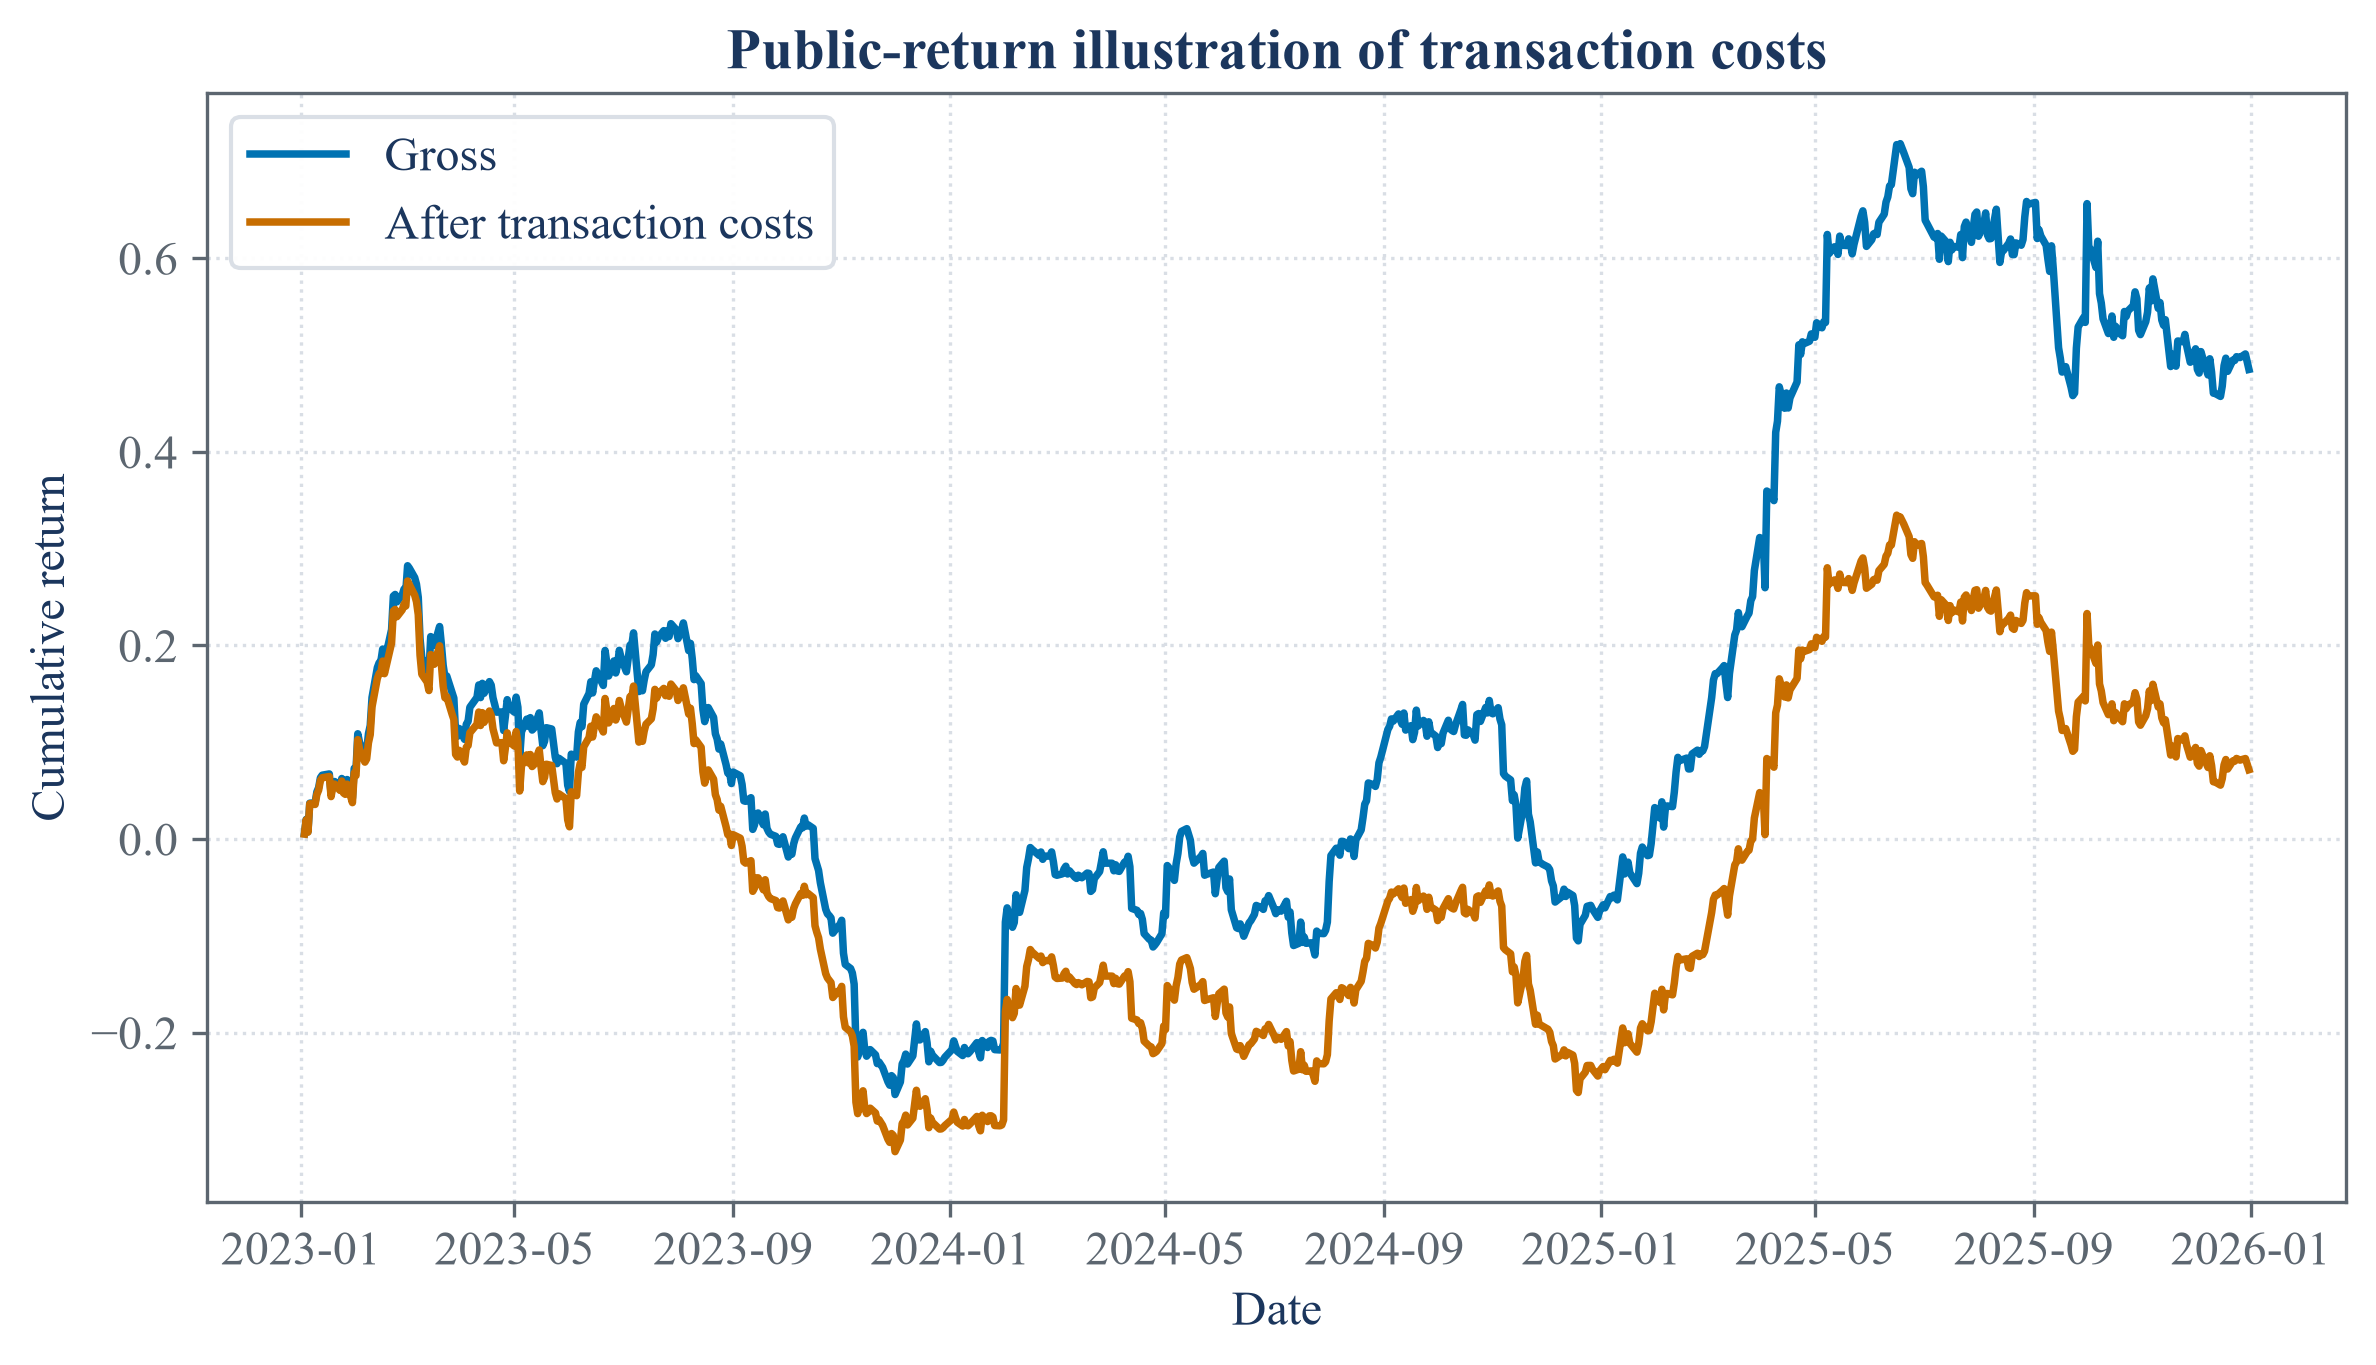
The public-data example is the last step of the protocol. Its interpretation remains conditional on the graph, assumptions, search record, and validation choices documented earlier.
The protocol improves traceability; it does not guarantee that the assumptions are true or that a historical result will persist in a future market.
Notebooks
| 1. Choosing adjustment variables from chronological evidence |
| 2. Building portfolios through chronological folds |
| 3. Validating the research record before estimation |